Bitcoin (BTC) is ready to break $90,000, an attractive investment opportunity! (11/27/25)

Jakarta, Pintu News – Bitcoin has started a recovery wave by breaking above $88,000. Currently, BTC is consolidating and may soon target a rise above the $90,000 zone.
Bitcoin Price Recovery: What Happened?
Bitcoin (BTC) managed to hold above the $83,500 level and formed a strong base for recovery. Recently, Bitcoin started a wave of recovery by breaking through the $85,500 resistance zone. This rise came after Bitcoin successfully crossed the $86,000 resistance and pushed the price above the 50% Fibonacci retracement level of the decline from $92,872 to $80,595. However, now the bears are still trying to prevent the rise above the $90,000 zone.
Also Read: Invest $1,000 in XRP: Potential Profits to Reach Tens of Thousands of Dollars in 2040?
Technical Analysis and Upside Potential
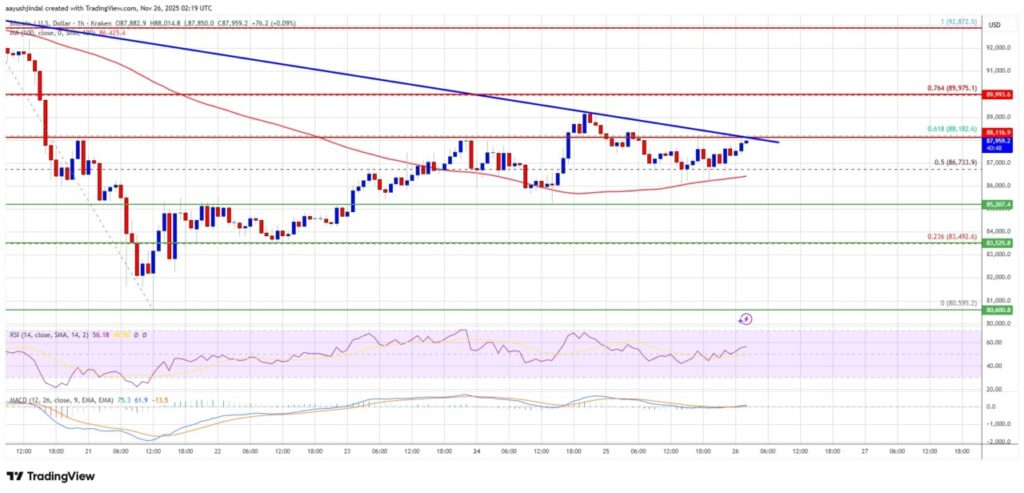
There is a bearish trend line forming with resistance at $88,200 on the hourly chart of the BTC/USD pair. Bitcoin is now trading above $87,000 and the hourly simple moving average of 100. If the bulls attempt another recovery wave, the price may face resistance near the $88,200 level. The first key resistance is near $89,000, followed by $90,000 or the 76.4% Fibonacci retracement level of the decline from $92,872 to $80,595.
Possible Bitcoin Price Drop
If Bitcoin fails to rise above the $90,000 resistance zone, the price could start falling again. Immediate support is near the $86,700 level, with the first major support near $86,200. The next support is now near the $85,000 zone. Further losses might send the price towards the $83,500 support in the short term. The key support is at $82,000, below which BTC might accelerate the decline in the short term.
Technical and Support Indicators
The hourly MACD indicator is currently firming up in the bullish zone. Meanwhile, the Relative Strength Index (RSI) for BTC/USD is now above the 50 level. The key support level is $86,200, followed by $85,000. Meanwhile, the key resistance levels are $89,000 and $90,000. If Bitcoin manages to break above $90,000, this could be a strong bullish signal for investors and traders.
Conclusion and Investment Opportunities
With Bitcoin now on the verge of rising above $90,000, investment opportunities look promising. Investors and traders should monitor technical indicators and support and resistance levels to make informed investment decisions. A rise above $90,000 could pave the way to higher levels such as $91,750 and potentially further up to $92,500.
Also Read: Hedera (HBAR) Needs Nearly 40% Hike to Recover November Losses
Follow us on Google News to get the latest information about crypto and blockchain technology. Check Bitcoin price today, Solana price today, Pepe coin and other crypto asset prices through Pintu Market.
Enjoy an easy and secure crypto trading experience by downloading Pintu crypto app via Google Play Store or App Store now. Also, get a web trading experience with various advanced trading tools such as pro charting, various types of order types, and portfolio tracker only at Pintu Pro.
*Disclaimer
This content aims to enrich readers’ information. Pintu collects this information from various relevant sources and is not influenced by outside parties. Note that an asset’s past performance does not determine its projected future performance. Crypto trading activities are subject to high risk and volatility, always do your own research and use cold hard cash before investing. All activities of buying andselling Bitcoin and other crypto asset investments are the responsibility of the reader.
FAQ
Q1: What is Bitcoin (BTC)?
A1: Bitcoin (BTC) is a digital currency or cryptocurrency first introduced in 2009, which uses peer-to-peer technology to facilitate instant payments.
Q2: Why does the price of Bitcoin (BTC) go up and down?
A2: The price of Bitcoin (BTC) can rise and fall due to various factors, including demand and supply in the market, investor sentiment, regulatory changes, and the influence of global financial markets.
Q3: What are Fibonacci retracement levels?
A3: Fibonacci retracement levels are technical analysis tools used to determine potential support or resistance levels based on previous price movements.
Q4: What is the Relative Strength Index (RSI)?
A4: The Relative Strength Index (RSI) is a momentum indicator used in technical analysis to measure the speed and change of price movements.
Q5: How to invest in Bitcoin (BTC)?
A5: To invest in Bitcoin (BTC), individuals can purchase Bitcoin through cryptocurrency exchanges, use digital wallets for storage, and monitor the market to understand price trends.
Reference
- NewsBTC. Bitcoin Price Rebound Picks Up Pace, BTC Could Retest $90K. Accessed on November 27, 2025