Solana Price Forecast: Bullish Momentum Builds as Derivatives Surge, Eyes Set on $160 Breakout
Jakarta, Pintu News – Solana prices at the start of the week were trading at around $139, up 5.5%, continuing the recovery that started from the $128 zone earlier this week. This recovery is attempting to break the downward trend line of the past two months, but the price is still stuck below the set of moving averages which continues to be an area of resistance during the downward trend.
Trendline Rejection Limits Recovery Efforts

On the 4-hour chart (8/12), Solana is pressuring a downtrend line around $140, an obstacle that has resisted every upside attempt since October. The current move is the third retest of this line in the last two weeks, showing consistent buying interest but also selling pressure that continues to emerge at higher levels.
Read also: Countdown to the FOMC Meeting: What Could Be in Store for BTC, ETH, SOL, XRP & LINK?
Prices are currently above the 20-day EMA at $134.93 and the 50-day EMA at $135.65, which now serve as short-term support. The 100-day EMA at $137.53 is being tested intraday, while the 200-day EMA at $145.98 remains the key limit for a reversal.
As long as the price has not been able to cross the 200-day EMA, the movement structure is still corrective and has not shown a strong trend change.
The Parabolic SAR indicator indicates that buyers are attempting to gain control of the momentum, but the SAR’s previous change of direction failed to produce a sustained trend reversal.
As such, the current technical setup reflects a recovery attempt within the broader downtrend, rather than a confirmed breakout.
Intraday Momentum Strengthens, but Needs Further Confirmation
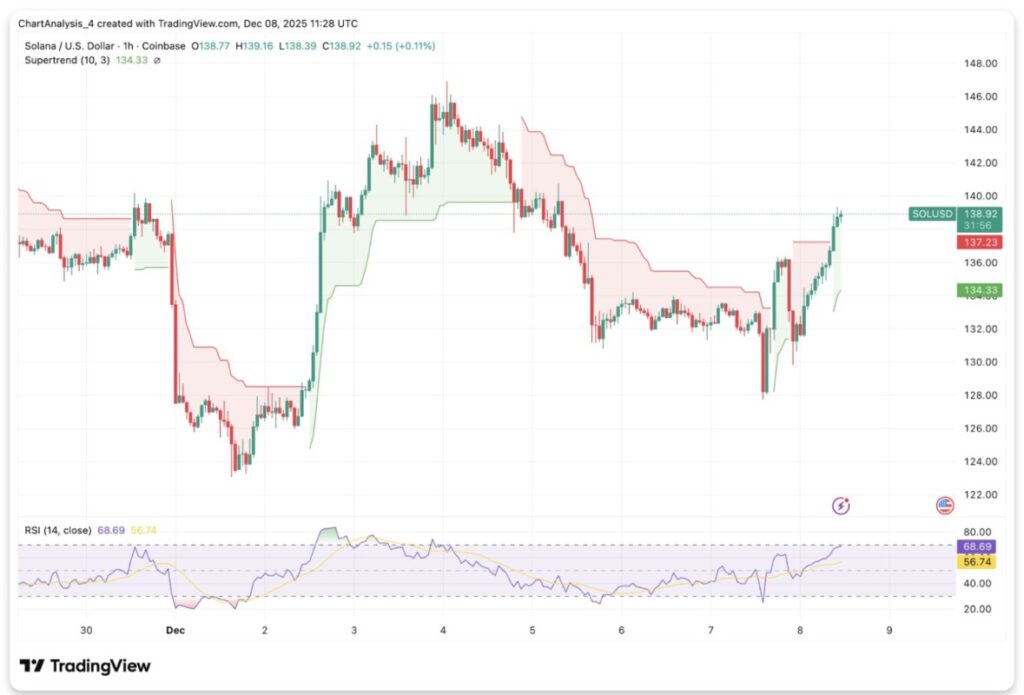
On the 1-hour chart (8/12), Solana has managed to reclaim the Supertrend flip zone at $134.33, which is now short-term support. The latest rally pushed the price to the $139 range with candles showing acceleration, and the RSI briefly touched overbought levels, indicating a momentum push, not just random movements.
The RSI is currently at 68, which still gives room for continuation, but also increases the risk of rejection at the resistance area if volume weakens. Intraday traders need a clean close above $140 to sustain a breakout attempt towards the 200-day EMA.
If it fails, the price will likely return to the $135-$134 range, where support will be tested again. The current structure favors an upside attempt with a mild correction, but the trend line above still makes this move fragile until there is clear confirmation.
Spot Flows Start to Improve, but Still Limited
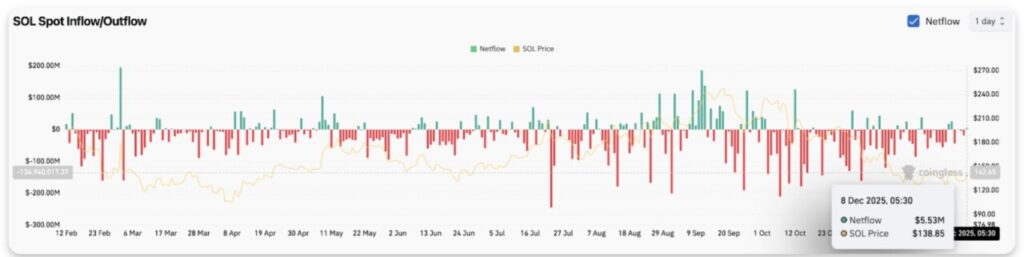
Spot flows have started to show improvement, albeit in relatively small amounts. On December 8, Solana recorded net inflows of around $5.53 million, reversing the negative trend that dominated during the previous week.
This change in flows helps explain the price recovery from the $128 level, but the magnitude of inflows is still much smaller compared to the previous accumulation phase, where flows could exceed $50 million per session.
Derivatives data shows expansion as traders brace for hike

Derivatives market data showed a significant shift in trader positioning. Open interest for Solana futures contracts rose 1.24% to $7.27 billion, while trading volume jumped 131.72% to $16.35 billion – signaling that leveraged traders were active again. The options market also recorded a sharp surge, with options volume increasing 285.88% and options open interest up 20.90%.
Read also: Shiba Inu Observer Reveals 3 Main Keys for SHIB to Shine Again Like 2021
The positioning direction of the majority of traders tends to be net long, with some exchanges showing ratios of more than 2.5:1, and accounts on Binance showing ratios of up to 3.23. This broad long bias indicates that traders are trying to take positions early before a potential breakout, rather than hedging against a decline.
Liquidation data further corroborates this view. In a 12-hour period, Solana recorded $8.93 million worth of liquidations, with short positions suffering the largest losses. This position clearance is likely to be the trigger that allows prices to break short-term resistance.
On-Chain Activity Supports the Power Narrative
Beyond price movements, Solana continues to show its dominance in network activity. Based on data from DeFiLlama, Solana recorded $24.2 billion in DEX volume in the period December 1-7, outperforming Ethereum and all other blockchains for the 16th consecutive week.
The next closest blockchain is Ethereum with a volume of $13.4 billion, followed by Binance Smart Chain with $13.08 billion.
This performance reinforces Solana’s position as a leader in base-layer trading activity, a factor that has historically supported prices when macro conditions are uncertain. The high throughput and stable liquidity made it easier for capital flows to return to SOL once technical barriers were broken.
Outlook: Will the Solana Price Rise?
A bullish scenario will occur if Solana manages to break the resistance area in the range of $140-$146, supported by increased spot inflows and derivative volumes that remain high. Such a structure would reflect market confidence and open up further upside opportunities towards targets in the $160-$163 range.
Conversely, the bearish scenario will activate if the price fails to break the trend line and drops below the $134 level. This could trigger a drop back to the $128 area, even opening the possibility of retesting the lower liquidity zone.
That’s the latest information about crypto. Follow us on Google News to get the latest crypto news about crypto projects and blockchain technology. Also, learn crypto from scratch with complete discussion through Pintu Academy and stay up-to-date with the latest crypto market such as bitcoin price today, xrp coin price today, dogecoin and other crypto asset prices through Pintu Market.
Enjoy an easy and secure crypto trading experience by downloading Pintu crypto app via Google Play Store or App Store now. Also, get a web trading experience with various advanced trading tools such as pro charting, various types of order types, and portfolio tracker only at Pintu Pro.
*Disclaimer
This content aims to enrich readers’ information. Pintu collects this information from various relevant sources and is not influenced by outside parties. Note that an asset’s past performance does not determine its projected future performance. Crypto trading activities have high risk and volatility, always do your own research and use cold cash before investing. All activities of buying and selling bitcoin and other crypto asset investments are the responsibility of the reader.
Reference:
- Coinedition. Solana Price Prediction: Bulls Eye Breakout Toward $160 As Derivatives Expand Sharply. Accessed on December 9, 2025