XRP price drops again, will there be another wave of volatility?
Jakarta, Pintu News – The price of Ripple has begun to enter a correction phase after recording gains above $2,150, raising new concerns about potential volatility that may increase in the near future. This has led traders and investors to anticipate more dynamic price movements.
XRP Enters Consolidation Phase
Ripple (XRP) has declined from the $2,180 area and is now consolidating after breaking the key levels of $2,150 and $2,120. Despite the correction, buying pressure is still visible above the $2,080 support area, which is an important limit for the bulls. The hourly chart of the XRP/USD pair also shows a bullish trend line with support at $2,070.
XRP is currently moving above $2,050 and holding above the 100-hour simple moving average (SMA). In a recovery scenario, the price is expected to face first resistance in the $2,120 area, followed by strong resistance at $2,150. If these two levels are passed, the market has a chance to retest $2,180 as the next upside target.
Also Read: Will Dogecoin (DOGE) be back in the hands of the bulls by early 2026?
Downside Risk if Resistance Fails to Break
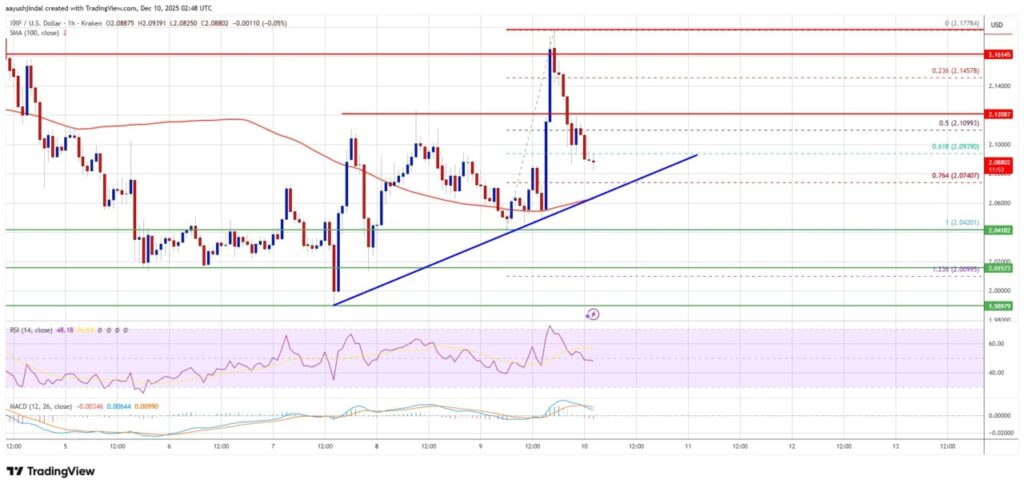
If Ripple (XRP) fails to cross the $2,120 resistance zone, the selling pressure could increase again. Initial support is around $2,070, which coincides with the 76.4% Fibonacci retracement level of the $2,042 to $2,178 upside move and the price trend line. The next important support lies at $2,050.
A close below $2,050 could be a further bearish signal, opening the door for a drop to the $2,00 psychological zone. If the selling pressure persists, the next support targets are expected to be at $1,985 and then $1,920, which could be the lower limit for the short-term price movement.
Technical Indicators Reinforce Bearish Signal
Technical indicators show an increasingly clear bearish bias. The hourly MACD for the XRP/USD pair shows increasing negative momentum. The hourly RSI is also moving below the 50 level, indicating the diminishing strength of buyers. Under these conditions, the $2,070 and $2,050 support levels become key areas to defend to prevent a deeper drop. On the contrary, an upside requires a convincing break of $2,120 and $2,180 levels.
Conclusion
With fast-changing market dynamics, traders need to monitor key technical levels and momentum indicators to anticipate potential further volatility. Understanding the support and resistance areas will be key in dealing with the uncertainty of Ripple (XRP) price movements in the near future.
Also Read:Michael Saylor Signaled New Bitcoin Purchases, BTC Price Ready to Skyrocket?
Follow us on Google News to get the latest information about crypto and blockchain technology. Check Bitcoin price today, Solana price today, Pepe coin and other crypto asset prices through Pintu Market.
Enjoy an easy and secure crypto trading experience by downloading Pintu crypto app via Google Play Store or App Store now. Also, get a web trading experience with various advanced trading tools such as pro charting, various types of order types, and portfolio tracker only at Pintu Pro.
*Disclaimer
This content aims to enrich readers’ information. Pintu collects this information from various relevant sources and is not influenced by outside parties. Note that an asset’s past performance does not determine its projected future performance. Crypto trading activities are subject to high risk and volatility, always do your own research and use cold hard cash before investing. All activities of buying andselling Bitcoin and other crypto asset investments are the responsibility of the reader.
FAQ
What is Ripple (XRP)?
Ripple (XRP) is a digital asset used in the Ripple payment network to facilitate cross-currency transactions quickly and efficiently.
Why has the XRP price decreased?
XRP price dropped due to a correction after peaking above $2,180 and facing selling pressure that brought the price into a consolidation phase.
What support levels are important for XRP right now?
Key supports are at $2,070 and $2,050. If these two levels fail to hold, the price could potentially drop towards $2.00 or lower.
What do the MACD and RSI indicators do in XRP price analysis?
MACD measures market momentum to identify potential trend changes, while RSI indicates the relative strength of prices and overbought or oversold conditions.
What are the risks if the XRP price continues to fall?
A sustained decline could trigger investor losses and increase bearish pressure, potentially taking XRP to lower support levels such as $1,985 or $1,920.
Reference
- NewsBTC. XRP Price Positive Streak Fades. Accessed on December 10, 2025.


