Is SEI About to Surge? On-Chain Activity Signals Breakout Pressure
Jakarta, Pintu News – Although the SEI Network price is still moving in a consolidation phase at low levels, on-chain data shows different dynamics. Increased transaction volume and market participation indicate pressure that could potentially trigger a change in volatility.
In many cases, strengthening fundamentals and network activity often precede medium to long-term price movements, so the current state of the SEI is the object of monitoring by crypto market analysts.
SEI Price Consolidation
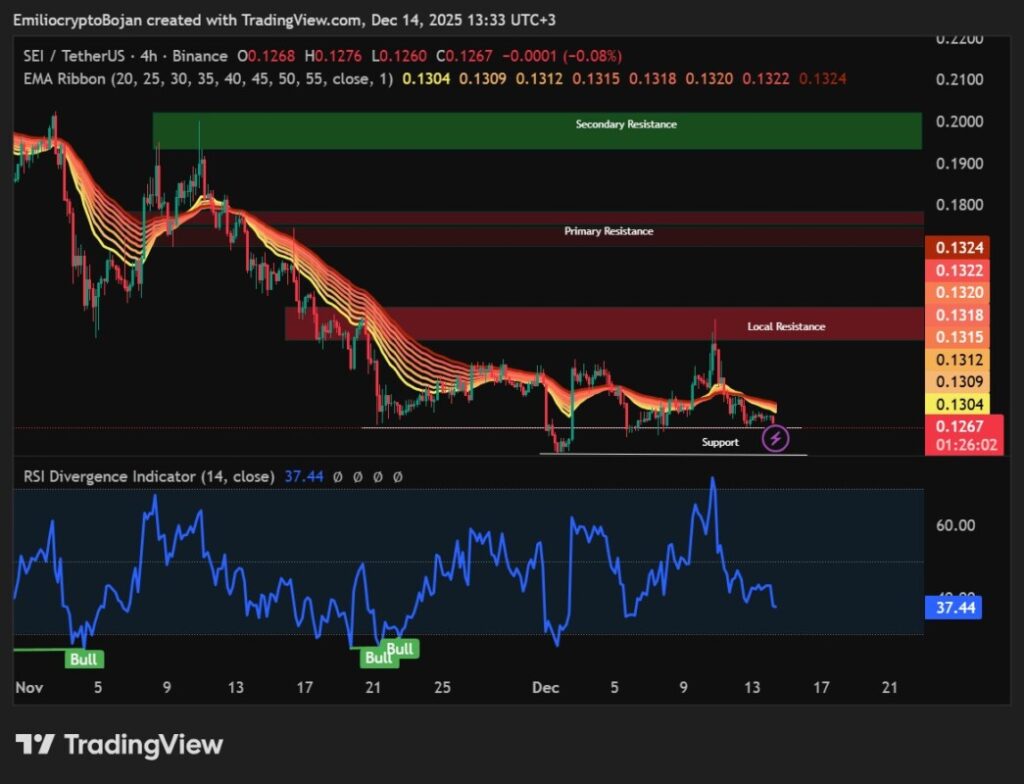
On the four-hour time frame, SEI prices are still holding at the bottom of their trading range and are held by the ribbon EMA, signaling short-term trend control is not yet in favor of buyers. Based on the technical data, this position leaves a risk of further downside if the support level cannot be maintained. The area around $0.1216 is noted as a relatively fragile low point should selling pressure increase again.
However, the price compression that occurred reflected a phase of indecision rather than market surrender. During this period, prices move in narrow ranges despite increased network activity. Such patterns have historically often appeared in transitional phases before a more decisive direction of movement is established.
Also Read: Charles Hoskinson Shares Cardano 2026 Big Plan: It’s the Future of ADA!
Surge in DEX Volume on SEI Network
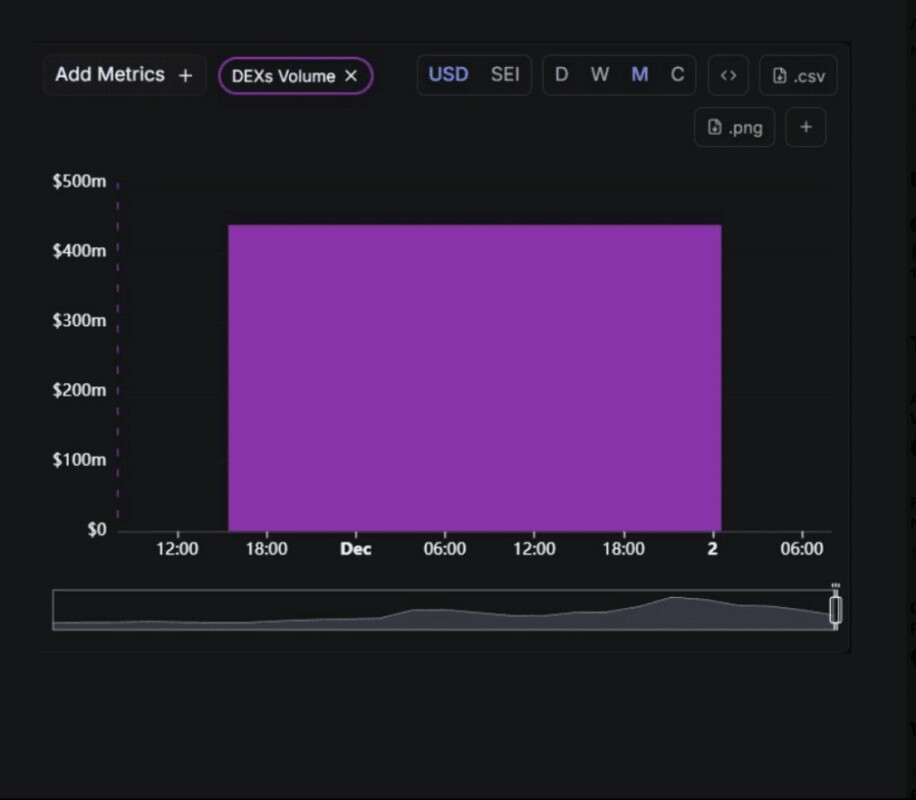
Amidst the price stagnation, SEI’s on-chain metrics showed significant improvement. Trading volume on the decentralized exchange (DEX) has surpassed $400 million in the past two weeks, based on network activity data. This spike signifies increased usage and transaction flow at lower price levels.
The difference between increased network activity and a relatively flat price is an important signal for analysts. In many on-chain analyses, strong user engagement during a consolidation phase is often interpreted as a phase of accumulation, not distribution, especially when it occurs near long-term support.
Increased Derivatives Market Activity
The SEI derivatives market shows a pattern in line with the on-chain data. The trading volume of perpetual contracts reportedly increased by 19,527% in the last 90 days, indicating aggressive position accumulation despite spot prices remaining stuck below the ribbon EMA. This data reflects the growing interest in front-term exposure.
Historically, a sharp expansion in the derivatives market during the price compression phase often precedes the resolution of the direction of the move. Such patterns are more often followed by increased volatility than the continuation of flat movements over the long term.
Conclusion
Structurally, the SEI sits between the measured downside risks and upside potential that technical analysts have mapped out. Failure to hold the $0.1216 level could potentially open room for further weakness, while success in breaking and holding above the ribbon EMA could shift the market momentum. In the event of a breakout from the current range, the $0.18-$0.20 supply zone will again be the area to monitor in evaluating the next price movement.
Also Read: Bitcoin Outlook 2026: Will it Reach $150,000?
Follow us on Google News to get the latest information about crypto and blockchain technology. Check Bitcoin price today, Solana price today, Pepe coin and other crypto asset prices through Pintu Market.
Enjoy an easy and secure crypto trading experience by downloading Pintu crypto app via Google Play Store or App Store now. Also, get a web trading experience with various advanced trading tools such as pro charting, various types of order types, and portfolio tracker only at Pintu Pro.
*Disclaimer
This content aims to enrich readers’ information. Pintu collects this information from various relevant sources and is not influenced by outside parties. Note that an asset’s past performance does not determine its projected future performance. Crypto trading activities are subject to high risk and volatility, always do your own research and use cold hard cash before investing. All activities of buying andselling Bitcoin and other crypto asset investments are the responsibility of the reader.
FAQ
What is SEI Network (SEI)?
SEI Network is a blockchain project focused on transaction efficiency, with the SEI token as the main utility asset in its ecosystem.
Why are SEI prices still consolidating at low levels?
SEI prices are still on hold as there is no short-term trend dominance, despite increased network activity and transaction volume.
How much has the SEI derivatives volume increased?
Data shows that SEI’s derivatives trading volume increased by around 19,527% in the last 90 days.
What are the key risks if SEI breaks below $0.1216?
A break below that level could open up an area of weaker lows and increase the risk of further declines.
Why are on-chain activities important in SEI analysis?
Increased on-chain activity when prices are stagnant is often an early indicator of changing volatility and shifting market dynamics.
Reference
- AMB Crypto. SEI stalls at lows but on-chain activity tells a different story. Accessed on December 15, 2025