XRP Price Fails to Break $2.0: Will it Continue to Fade? (12/16/25)
Jakarta, Pintu News – The price of XRP saw a fresh drop below $2.00. Currently, the price is struggling with resistance near the $2.020 level.
XRP Price Drop
XRP price tried to recover and broke above $2,120 but failed to continue rising, similar to Bitcoin and Ethereum . The price then fell back below $2,050 and $2,020. This decline included losing support at the $2.00 level, with the lowest price recorded being $1.9525.
Recently, the price tried to correct upwards, crossing the 50% Fibonacci retracement level of the decline from $2,047 to $1,952. However, sellers are still active near $2,00 and $2,020. There is also a bearish trend line with resistance at $2,020 on the hourly chart of the XRP/USD pair. Currently, the price is trading below $2.00 and the 100-hour simple moving average.
Also Read: Ethereum Headed to $5,000: Investment Opportunities Ahead of 2026!
Strong Resistance Ahead
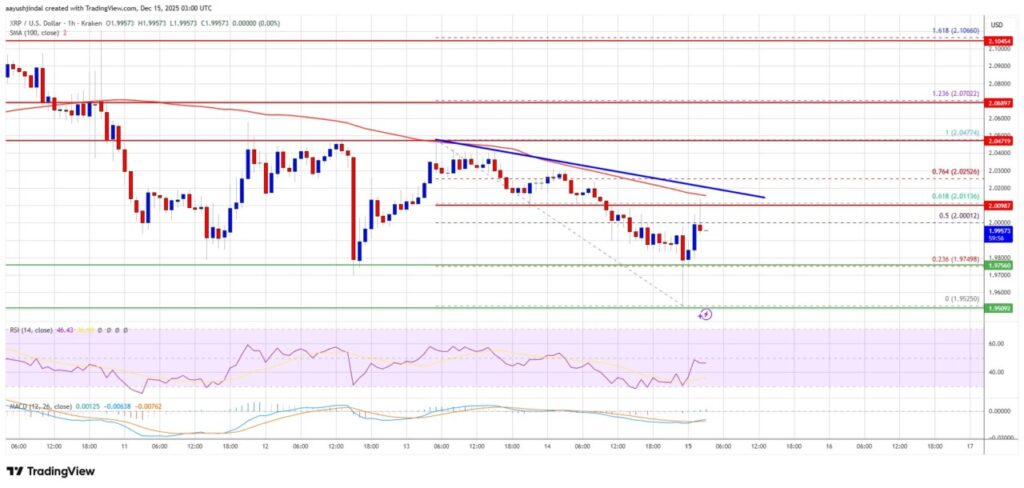
In case of another upside move, the price may face resistance near the $2,00 level. The first major resistance is near the $2,020 level or 61.8% Fibonacci retracement level of the decline from $2,047 to $1,952. A close above $2,020 could push the price towards $2,050.
The next resistance is at $2,080. If the price manages to cross the $2,120 resistance, it could be pushed towards the $2,150 resistance. A further rise might take the price towards the $2,20 resistance and then $2,250.
Possible Further Decline
If XRP fails to break the $2.020 resistance zone, the price could drop again. Initial support on the downside is near the $1.9650 level. The next major support is near the $1.950 level. In case of a downward breakout and close below the $1,950 level, the price may continue to drop towards $1,920. The next major support is located at the $1,880 zone, below which the price could continue to drop towards $1,820.
Technical Indicators
The hourly MACD for XRP/USD is currently showing acceleration within the bearish zone. Meanwhile, the hourly Relative Strength Index (RSI) for XRP/USD is now below the 50 level, indicating a greater bearish strength in the current market.
XRP Price Outlook
With challenges faced near critical resistance levels and technical indicators suggesting bearish momentum, the short-term outlook for XRP looks set to experience more pressure. Investors and traders should keep an eye on the mentioned support and resistance levels to take informed trading decisions.
Also Read: Bitcoin Stuck Below $94,000: When Will Price Recovery Happen?
Follow us on Google News to get the latest information about crypto and blockchain technology. Check Bitcoin price today, Solana price today, Pepe coin and other crypto asset prices through Pintu Market.
Enjoy an easy and secure crypto trading experience by downloading Pintu crypto app via Google Play Store or App Store now. Also, get a web trading experience with various advanced trading tools such as pro charting, various types of order types, and portfolio tracker only at Pintu Pro.
*Disclaimer
This content aims to enrich readers’ information. Pintu collects this information from various relevant sources and is not influenced by outside parties. Note that an asset’s past performance does not determine its projected future performance. Crypto trading activities are subject to high risk and volatility, always do your own research and use cold hard cash before investing. All activities of buying andselling Bitcoin and other crypto asset investments are the responsibility of the reader.
FAQ
Q1: What is XRP?
A1: XRP is a digital currency used in the Ripple network to facilitate money transfers between countries.
Q2: Why did the XRP price drop below $2.00?
A2: The price of XRP dropped below $2.00 as it failed to continue its rise above $2.120, similar to the declines seen in Bitcoin (BTC) and Ethereum (ETH).
Q3: What are the key resistance levels for XRP right now?
A3: The key resistance level for XRP is currently $2,020, followed by $2,050 and $2,080.
Q4: What will happen if XRP fails to break the $2,020 resistance?
A4: If XRP fails to break the $2,020 resistance, the price may drop again, with initial support at $1,9650 and next major support at $1,950.
Q5: What are the current technical indicators for XRP?
A5: The hourly MACD indicator for XRP/USD shows acceleration in the bearish zone, and the hourly RSI is below the 50 level, indicating bearish strength.
Reference
- NewsBTC. XRP Price Struggles Near $2.0. Accessed on December 15, 2025