5 Charts That Reveal Bitcoin May Be Heading Into a Bear Market as Early as 2026

Jakarta, Pintu News – Bitcoin was holding in the $88,000-$90,000 range as of Dec. 22, but the market structure behind the price movement appears increasingly fragile.
Increased volatility, dwindling liquidity, and declining demand have raised concerns that the crypto market may be transitioning from the late phase of a bull market to the early phase of a bear market ahead of January 2026.
Several on-chain and market structure indicators are now pointing in a similar direction. While no single indicator definitively confirms that a bear market has begun, the combination of signals indicates increasing downside risks and weakening price support levels.
Bitcoin’s demand growth appears to be slowing down
Bitcoin demand growth reflects how much new buying pressure there is compared to the available supply.
Read also: The Crypto Market Turns Green — Analyst Ali Martinez Highlights 3 Altcoins Poised to Shine
Recent data suggests that demand growth is now slowing down after several previous waves of increase in this cycle. Although Bitcoin prices remained high throughout most of 2025, demand was unable to reach new peaks.
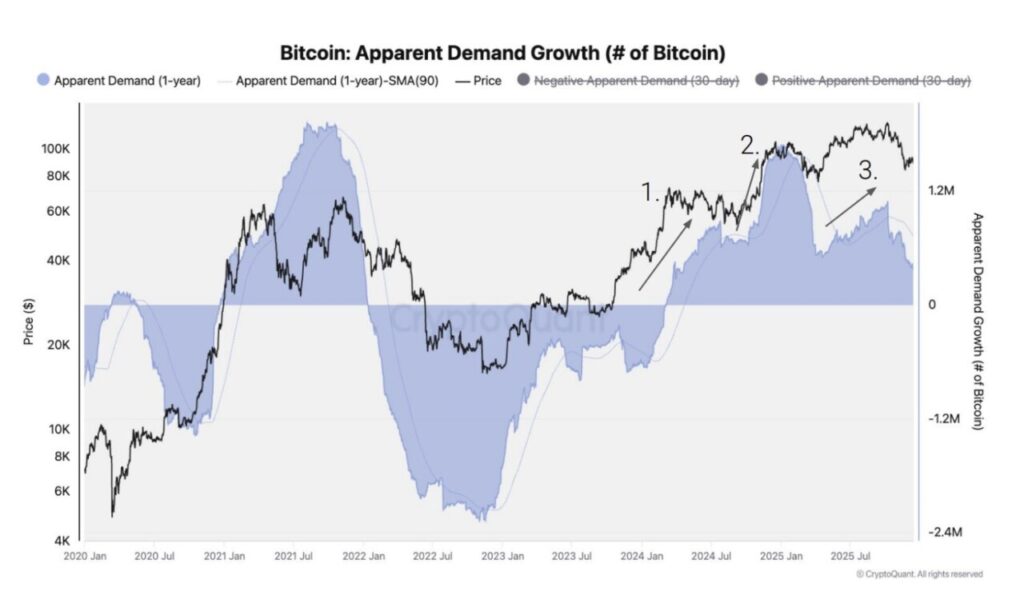
This discrepancy suggests that price strength is supported more by momentum and the use of leverage, rather than by real purchases in the spot market.
Historically, when demand growth starts to flatline or decline while prices remain high, the market usually shifts from an accumulation phase towards a distribution phase – which is often the start of a bear market or a long period of consolidation.
US Spot Bitcoin ETF Inflows Begin to Lose Momentum
Bitcoin spot ETFs in the United States have been a major source of structural demand in this cycle.
In 2024, ETF inflows increased consistently until the end of the year. However, in the fourth quarter of 2025, the inflows started to level off and even declined in some periods.
This change is important because ETFs reflect long-term capital flows, not short-term trading activity.
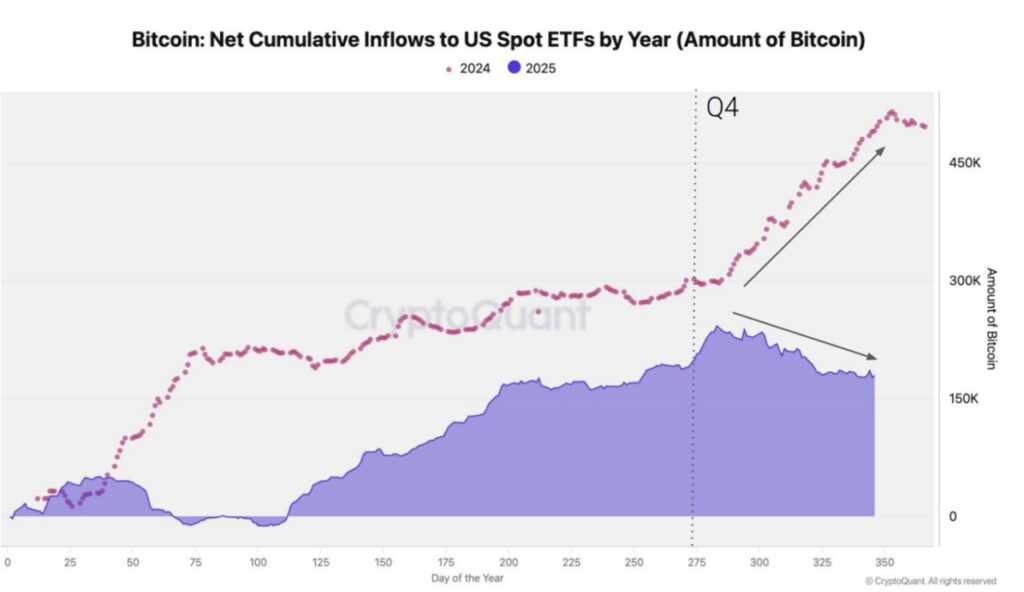
When demand from ETFs slows down while prices remain high, it indicates that large buyers are starting to hold back. Without sustained institutional inflows, Bitcoin becomes more vulnerable to volatility triggered by the derivatives market and speculative positions.
“Dolphin” wallet starts to reduce exposure
Wallets that hold 100 to 1,000 BTC, often referred to as “dolphins”, are generally associated with experienced investors and financial institutions.
Recent data shows a sharp decline in dolphin group ownership in the past year. A similar pattern was also seen in late 2021 and early 2022, ahead of a deeper market downturn.
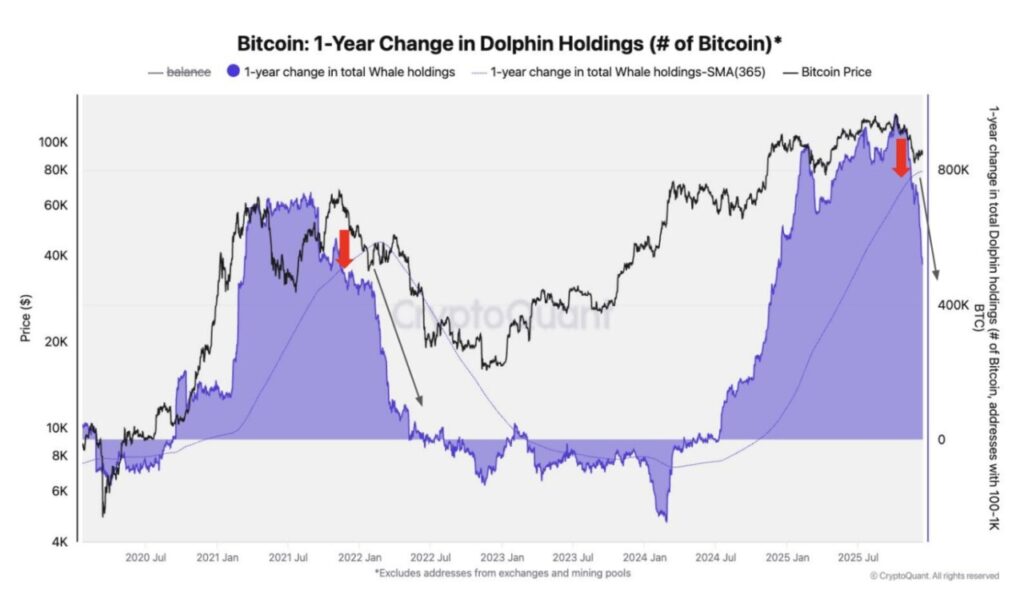
This is not a sign of panic selling, but rather an indication of risk reduction by experienced holders. Historically, when this group starts distributing assets while prices are still high, it reflects expectations of declining returns or a prolonged period of consolidation.
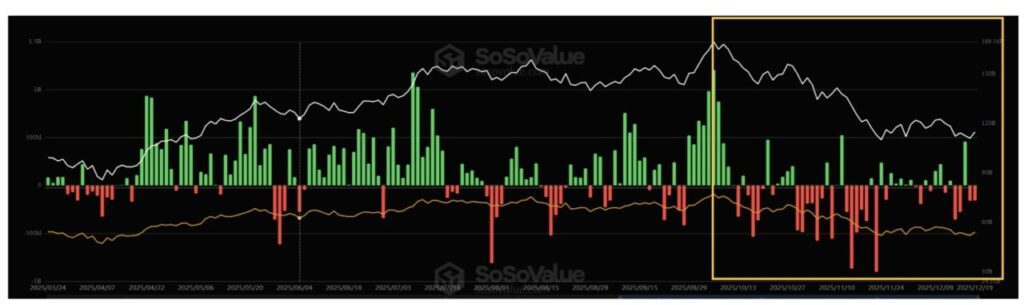
Funding Rate at Exchanges Starts to Decline
The funding rate measures the fee a trader has to pay to maintain a leveraged position.
On major exchanges, Bitcoin funding rates are showing a clear downward trend. This signals a declining demand for leveraged positions, even though the price is still relatively high.
Read also: “Altcoin Season Isn’t Over” – Why is 2026 Worth the Spotlight?
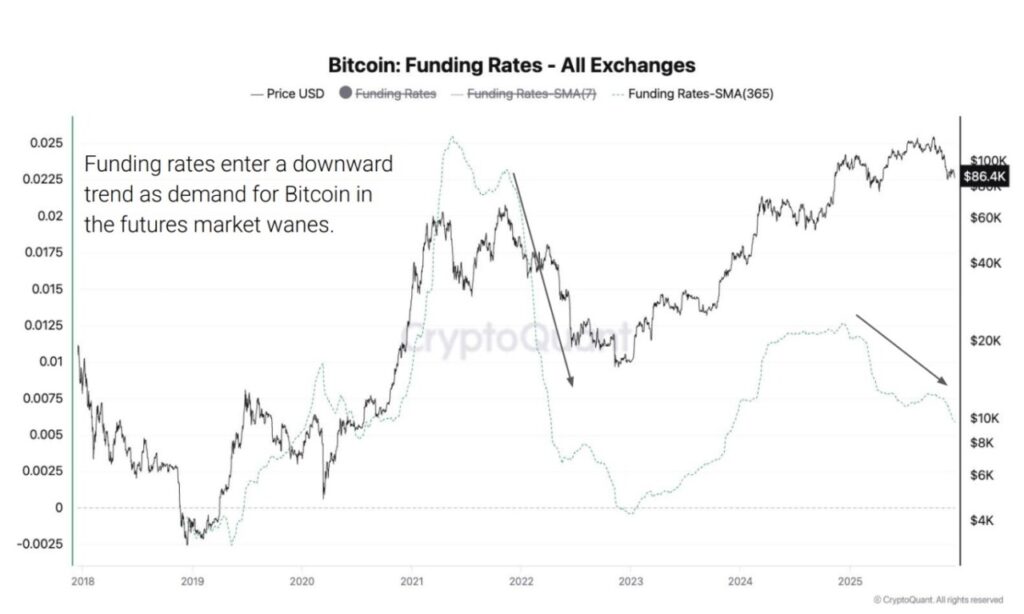
In a bull market, strong price rallies are usually supported by rising funding rates and sustained demand for long positions.
Conversely, a decrease in the funding rate indicates that traders’ confidence is starting to weaken and they are less willing to pay to maintain long positions. Such conditions often precede volatile price movements or major trend reversals.
Bitcoin Breaks Below 365-Day Moving Average
The 365-day moving average is a long-term trend indicator that has historically distinguished between bull markets and bear markets.
Currently, Bitcoin has been moving below this level for an extended period – for the first time since early 2022. Several macro-fueled market declines in 2024 and early 2025 briefly tested this level, but failed to close below it.
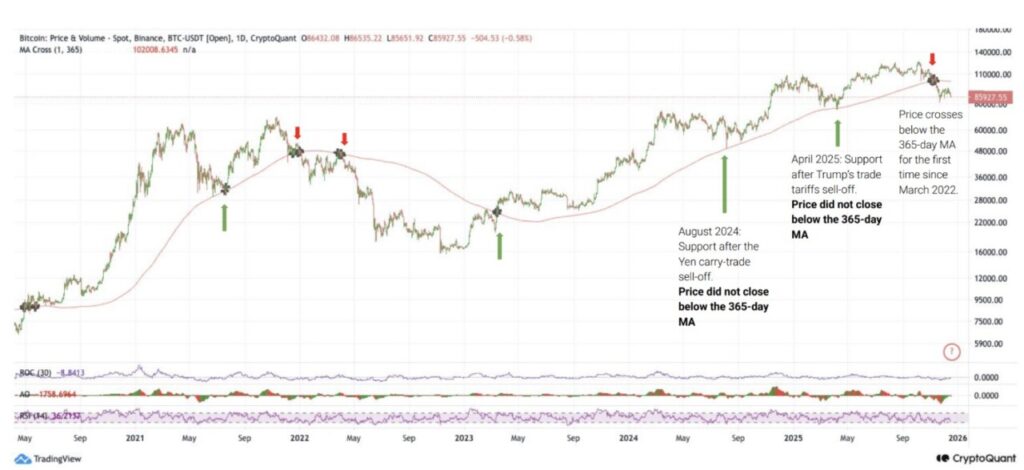
While a sustained break below the 365-day average does not necessarily signal a major fall, it does indicate a shift in long-term momentum and increases the likelihood that any future price rallies will encounter stronger resistance.
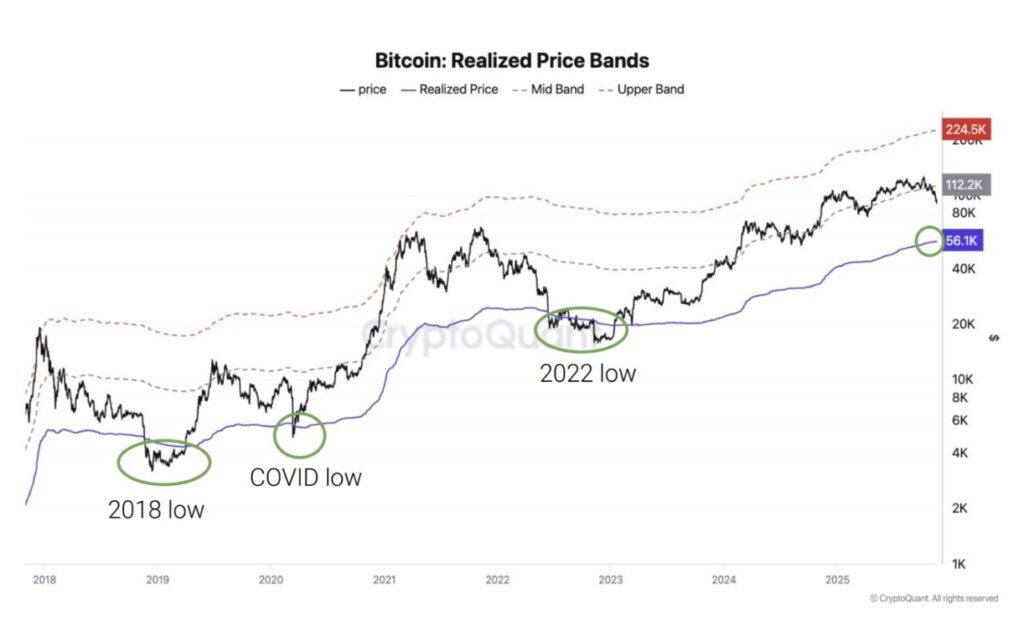
How Low Can Bitcoin Go If a Bear Market Occurs?
If these various signals continue to point in the same direction, historical data can be referenced – not as a definitive prediction, but rather as a guide to the range of movement.
Bitcoin’s realized price, which currently stands at around $56,000, reflects the average purchase price of all BTC holders. In previous bear markets, Bitcoin has often bottomed out around or slightly below this level.
This doesn’t mean Bitcoin will definitely drop to $56,000, but it does show that in a full bear market scenario, long-term buyers usually start to re-enter in that range.
Read also: Signs of Recovery Appear, 3 Altcoins Ready to End Distribution Phase and Rise?
Between the current price and the realized price, there is a wide range of outcomes, including the possibility of a prolonged flat movement instead of a sharp decline.
What This Means for Current Market Conditions
As of December 22, Bitcoin is still moving in a narrow range with thin liquidity and high sensitivity to leverage-based movements. Retail participation appears cautious, while institutional fund flows are slowing down.
Altcoins are in a more vulnerable position than Bitcoin, as they are more dependent on demand from retail investors and are quickly affected when liquidity decreases.
Taken together, these five indicators suggest that the crypto market may be entering a late-cycle distribution phase, with the risk of a bear market rising as early as 2026 if demand does not rebound.
The trend is weakening – not breaking completely – but the room for error is narrowing.
That’s the latest information about crypto. Follow us on Google News to get the latest crypto news about crypto projects and blockchain technology. Also, learn crypto from scratch with complete discussion through Pintu Academy and stay up-to-date with the latest crypto market such as bitcoin price today, xrp coin price today, dogecoin and other crypto asset prices through Pintu Market.
Enjoy an easy and secure crypto trading experience by downloading Pintu crypto app via Google Play Store or App Store now. Also, get a web trading experience with various advanced trading tools such as pro charting, various types of order types, and portfolio tracker only at Pintu Pro.
*Disclaimer
This content aims to enrich readers’ information. Pintu collects this information from various relevant sources and is not influenced by outside parties. Note that an asset’s past performance does not determine its projected future performance. Crypto trading activities have high risk and volatility, always do your own research and use cold cash before investing. All activities of buying and selling bitcoin and other crypto asset investments are the responsibility of the reader.
Reference:
- BeInCrypto. 5 Charts Suggest Bitcoin Could Enter a Bear Market in Early 2026. Accessed on December 24, 2025


