Ethereum Holds Steady Around $2,900 as Crypto Whales Begin Accumulating ETH

Jakarta, Pintu News – Reporting from BeInCrypto, the Ethereum price chart at first glance looks calm without much significant movement. The recent small decline has also been attributed to weak demand from retail investors.
However, beneath the surface, there are more significant dynamics. The latest on-chain data shows that the whales are starting to accumulate again. Moreover, one key indicator is signaling a rare trend change, which favors one of the two groups mentioned-most likely referring to whales over retail investors.
In other words, even if the price action looks sluggish, big moves behind the scenes could be the first sign of a change in direction for the Ethereum market.
Ethereum Price Up 1.15% in 24 Hours
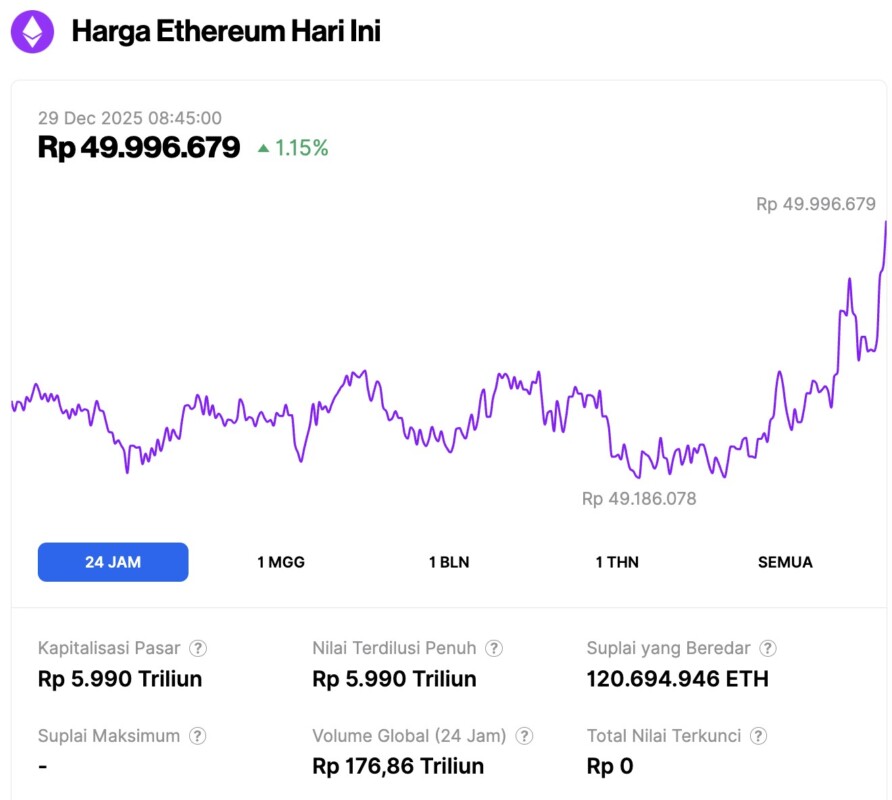
On December 29, 2025, Ethereum was trading at approximately $2,980, or around IDR 49,996,679 — marking a 1.15% increase over the past 24 hours. During this period, ETH reached a low of IDR 49,186,078 and peaked at IDR 49,994,660.
At the time of writing, Ethereum’s market capitalization stands at roughly IDR 5,990 trillion, while its 24-hour trading volume has surged by 41% to IDR 176.86 trillion.
Read also: Bitcoin Holds Steady at $87,000 as Analysts Point to Key Price Levels
Retail Investors Slow Down, While Whales Begin to Enter
Ethereum is currently nearing the completion of an inverse head-and-shoulders pattern, a bullish formation that indicates a potential trend reversal if the price manages to break the $3,390 level. However, a problem arises before that breakout point: momentum from retail investors weakened this week.
Between December 18 and 24, Ethereum’s price did show an upward trend, which is usually a positive signal. However, the Money Flow Index (MFI) indicator – which tracks the inflow and outflow of funds from assets – did not support the rise. Instead, the MFI printed a lower low, indicating that the price increase was most likely not supported by real buying from retail investors.
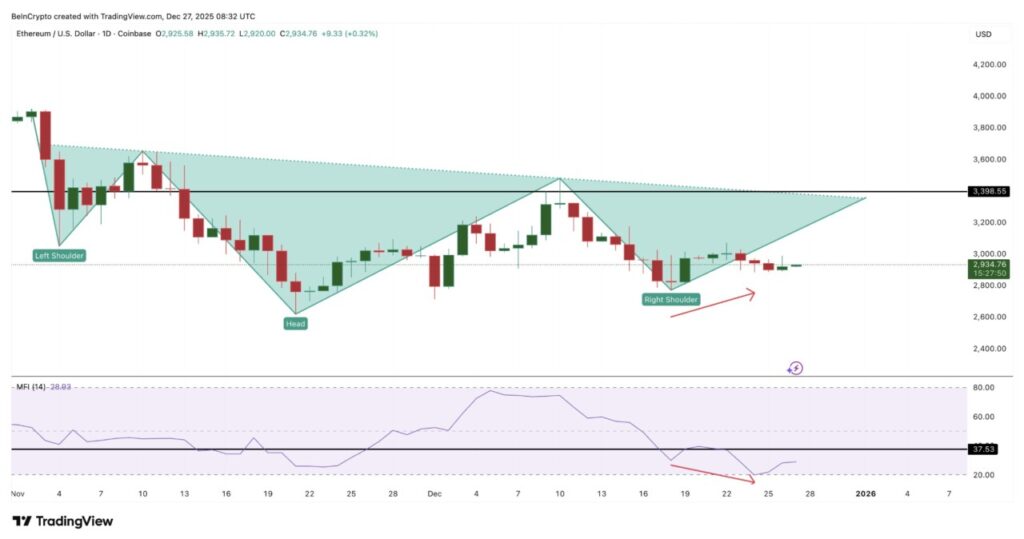
Currently, the MFI needs to rise above 37 to form a higher high and confirm an increase in demand.
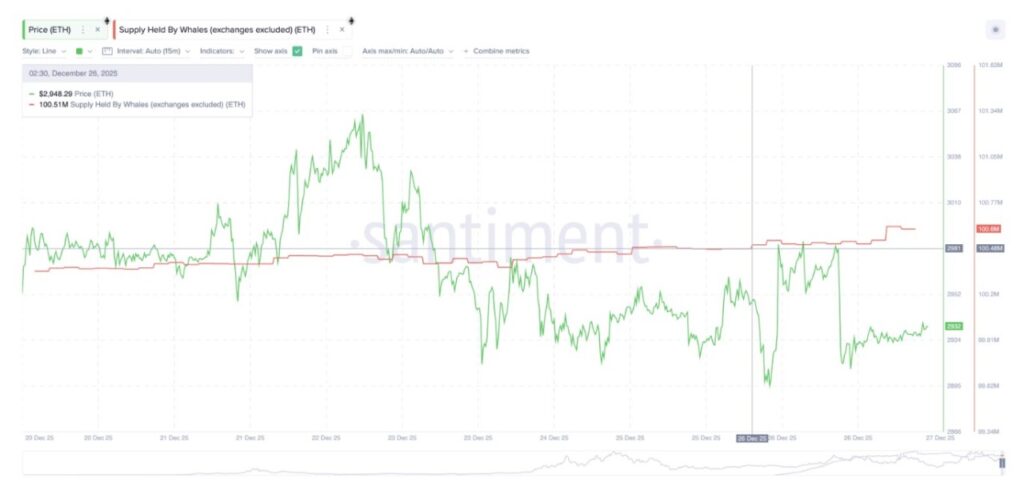
On the other hand, whales have shown the opposite reaction. Since December 26, large wallets have increased holdings from 100.48 million ETH to 100.6 million ETH.
At current prices, that represents around $350 million in funds coming in just in the last 24 hours. Whales typically don’t buy for short-term gains – they enter because they see strong setup potential.
It is this difference that defines the current state of the Ethereum market:
- Retail investors are hesitant
- Whale start accumulation
The next direction of the ETH price will largely depend on who stays more consistent in the market.
One Indicator Supports Whale Movement
The Relative Strength Index (RSI) momentum indicator is now showing signals in line with the whales’ accumulation action.
In the period between November 4 and December 25, an interesting phenomenon occurred:
- Price prints a lower low
- RSI actually prints a higher low
This condition is known as bullish divergence, which signals that selling pressure is starting to weaken, even though it is not yet reflected in the price movement directly.
Read also: 8 Cryptos with Strong Catalysts to Watch for in 2026

Bullish divergences like this are usually the support for trend reversal patterns like inverse head-and-shoulders. While it doesn’t guarantee a breakout, it does increase the probability of a successful breakout if the price reaches the trigger area – in this case, the $3,390 level.
This is the main reason why the whales are starting to add to their positions now. They see technical opportunities that are starting to form, even as the retail market is yet to make its move.
Ethereum Price Zone Will Determine the Next Direction
Ethereum price is currently at a crucial point that will determine the direction of its next move. To resume the potential uptrend, ETH must first reclaim the $3,050 level, which serves as both short-term resistance and an important psychological boundary.
If the price manages to break $3,050 with convincing strength, the next target is the neckline breakout zone at $3,390. This is the trigger point of the inverse head-and-shoulders pattern that is forming.
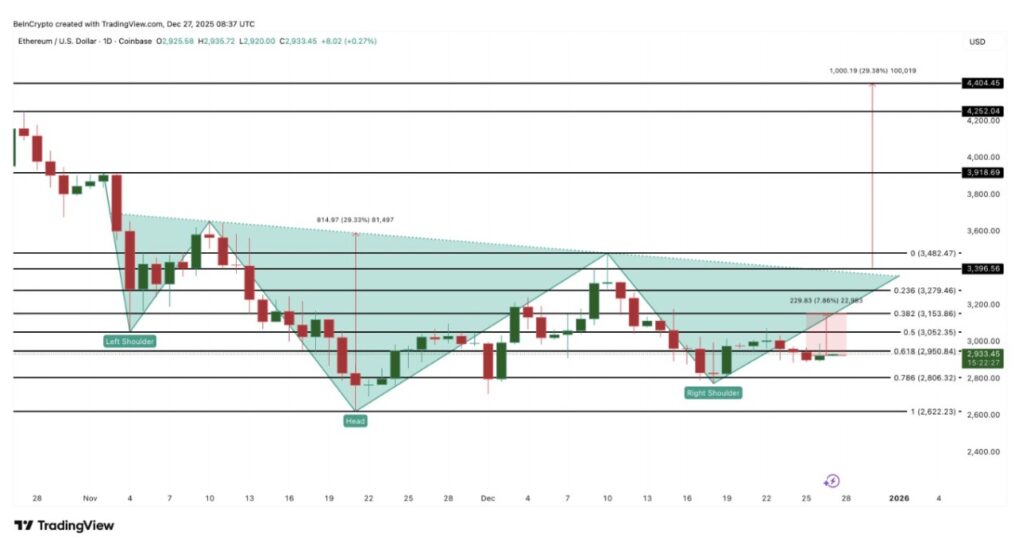
If ETH breaks above $3,390, then the pattern could be fully activated, with a technical target towards around $4,400. This target is calculated by adding the height of the “head” in the pattern to its breakout point.
However, on the downside, if the price falls below $2,800, then the bullish momentum will start to weaken. If the selling pressure increases and the whales stop accumulating, Ethereum price could drop further to around $2,620. A drop below this level would invalidate the bullish reversal structure that is forming.
That’s the latest information about crypto. Follow us on Google News to get the latest crypto news about crypto projects and blockchain technology. Also, learn crypto from scratch with complete discussion through Pintu Academy and stay up-to-date with the latest crypto market such as bitcoin price today, xrp coin price today, dogecoin and other crypto asset prices through Pintu Market.
Enjoy an easy and secure crypto trading experience by downloading Pintu crypto app via Google Play Store or App Store now. Also, get a web trading experience with various advanced trading tools such as pro charting, various types of order types, and portfolio tracker only at Pintu Pro.
*Disclaimer
This content aims to enrich readers’ information. Pintu collects this information from various relevant sources and is not influenced by outside parties. Note that an asset’s past performance does not determine its projected future performance. Crypto trading activities have high risk and volatility, always do your own research and use cold cash before investing. All activities of buying and selling bitcoin and other crypto asset investments are the responsibility of the reader.
Reference:
- BeInCrypto. Ethereum Whales Add Over $350 Million While Retail Hesitates – What Are They Seeing? Accessed on December 29, 2025


