PEPE Price Soars 64% to Kick Off the New Year — What It Will Take to Reach a New All-Time High

Jakarta, Pintu News – PEPE started the new year with a significant surge, jumping about 63% in the last seven days. This surge comes after several weeks of narrowing and correction, during which PEPE prices broke out of a bearish wedge pattern.
As speculative interest in high-risk assets returns, traders are now considering whether this spike marks the beginning of a sustained trend reversal.
With the price of PEPE currently consolidating just below the key resistance zone, will this memecoin be able to reach a new peak in 2026?
PEPE’s rally slows down, but not yet a failure
Supporting this bullish narrative, a number of indicators continue to show an improving uptrend despite short-term corrections.
Read also: Pi Network Price Prediction in 2026: How High Can Pi Coin Fly?
On the 4-hour chart (7/1), the Relative Strength Index (RSI) indicator hovers around the 58.72 level, which puts PEPE in bullish territory. This RSI structure suggests that momentum is still positive, with buyers remaining in control as the price consolidates near recent highs.
Importantly, the RSI’s ability to stay above the neutral 50 level indicates trend strength, not exhaustion. If this continues, there is potential room for uptrend continuation.
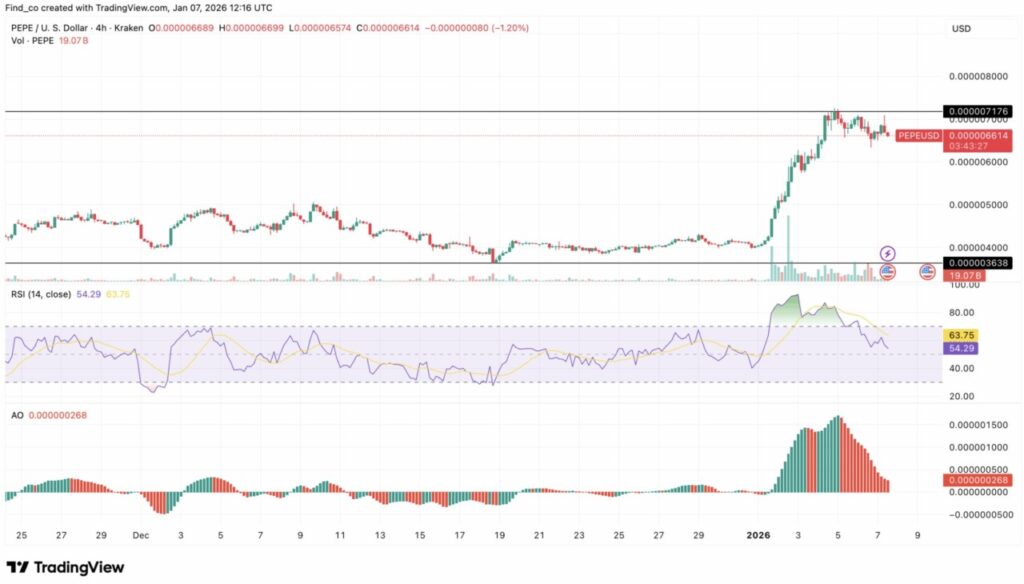
Meanwhile, the Awesome Oscillator (AO) indicator remains in the positive zone, reinforcing the overall bullish bias. Although the histogram is starting to print red bars, this is more indicative of a slowdown in momentum rather than an overall trend reversal.
In this market context, the contraction of AO is considered a healthy pause after an impulsive move. As long as the AO remains above the zero line, PEPE’s bullish structure is likely to be maintained.
Sales Volume Declines
From an on-chain perspective, the PEPE rally requires profit-taking to cool down the price movement and keep the uptrend healthy.
Data from Santiment shows that the number of daily on-chain transactions made at a profit spiked on January 1, which usually signals that holders started selling as the price rose.
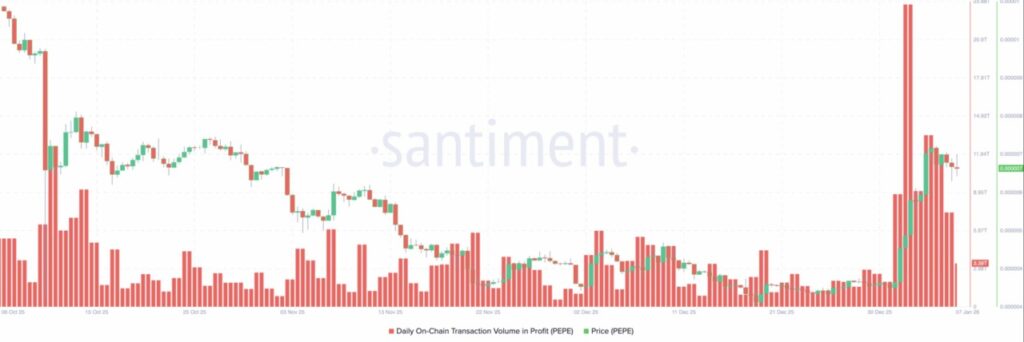
However, the selling pressure has since subsided. To date, the number of profitable transactions has decreased, which suggests that fewer traders are in a hurry to secure profits.
If this trend continues, PEPE prices may still have room to continue rising as selling pressure gradually begins to dissipate.
PEPE Price Outlook: Bullish Signal
After successfully breaking out of the bearish wedge pattern on the daily time frame, the Chaikin Money Flow (CMF) indicator reversed to positive territory.
Read also: Top 3 Crypto Price Predictions: Dogecoin, Cardano, and Chainlink Ready for a Big Jump?
In addition, the price of PEPE is currently testing nearby resistance levels, with the strength of buyers continuing to increase. The Moving Average Convergence Divergence (MACD) indicator shows a similar pattern, with the 12-day EMA breaking above the 26-day EMA, reinforcing the bullish bias.
Although the histogram bars have started to shrink – indicating a slight weakening of momentum – the overall trend is still directed upwards. If the price manages to break the current resistance sustainably, the opportunity to rally towards the previous swing high will open up.
At the same time, the breakout from the wedge pattern and the support from moving averages remain a strong support if PEPE prices experience a correction.
Fibonacci retracement levels provide additional context.
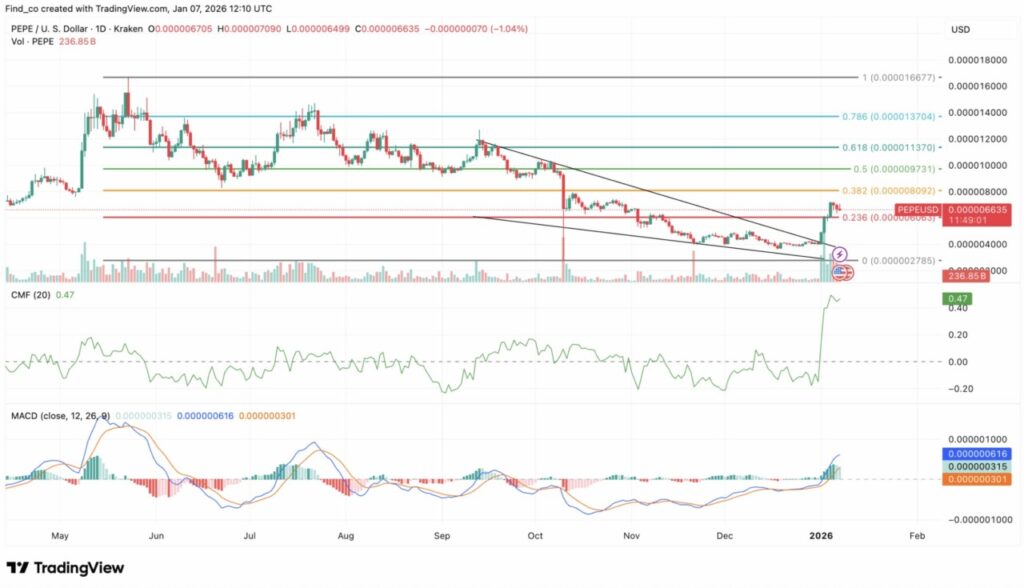
As of January 7, PEPE price is showing signs of reversal from the major resistance zone, although it is still between the Fibonacci levels of 0.236 and 0.382. This range suggests that despite the ongoing short-term profit-taking, PEPE’s overall bullish price structure is still intact.
If the price manages to break the $0.0000082 level, it could be a signal of a continuation towards higher Fibonacci targets. Meanwhile, the support level around $0.0000061 could serve as a buffer against a deeper correction.
At some point, however, these memecoins may experience a correction. But if the buying volume increases throughout the year, the price of PEPE could rise to $0.00017 – potentially even setting a new record high.
Conversely, if the price fails to hold above the $0.0000061 support level, then there is a possibility of a deeper retracement occurring, with the next support target around $0.0000037.
That’s the latest information about crypto. Follow us on Google News to get the latest crypto news about crypto projects and blockchain technology. Also, learn crypto from scratch with complete discussion through Pintu Academy and stay up-to-date with the latest crypto market such as bitcoin price today, xrp coin price today, dogecoin and other crypto asset prices through Pintu Market.
Enjoy an easy and secure crypto trading experience by downloading Pintu crypto app via Google Play Store or App Store now. Also, get a web trading experience with various advanced trading tools such as pro charting, various types of order types, and portfolio tracker only at Pintu Pro.
*Disclaimer
This content aims to enrich readers’ information. Pintu collects this information from various relevant sources and is not influenced by outside parties. Note that an asset’s past performance does not determine its projected future performance. Crypto trading activities have high risk and volatility, always do your own research and use cold cash before investing. All activities of buying and selling bitcoin and other crypto asset investments are the responsibility of the reader.
Reference:
- CCN. PEPE Price Rallies 64% in New Year Breakout – Here’s What Needs to Happen for a New High. Accessed on January 8, 2026