Ethereum is ready to soar higher than Bitcoin – the right time to sell is revealed!

Jakarta, Pintu News – After experiencing a recovery, Ethereum and Bitcoin are showing strong momentum again with a gain of more than 7% in the last week. A crypto analyst has shared a detailed analysis of the ETH/BTC pair chart, predicting the next moves and defining specific sell zones.
Ethereum Approaches Critical Sell Zone Against Bitcoin
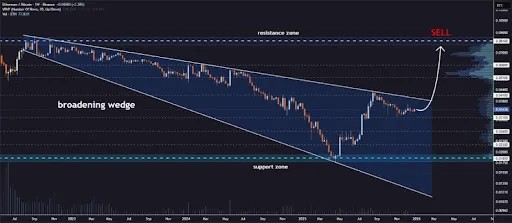
John Carter, a crypto market technician, has described a bullish setup for the Ethereum (ETH) against Bitcoin (BTC) pair in his latest chart analysis on X. Ethereum is now at a critical juncture, with the price approaching an important technical level in the Broadening Wedge pattern. This structure has steered Ethereum’s performance relative to Bitcoin (BTC) for several years, with prices fluctuating between broadening trend lines.
Recently, ETH/BTC bounced off the lower support zone of the Broadening Wedge, confirming that buyers are still defending the level. The recovery from the support was sharp and clear, and after touching the lower boundary of the wedge, the pair started a strong recovery. This upward movement pushed the price back to the upper half of the wedge, putting ETH/BTC on a direct path towards resistance.
Also Read: Ethereum (ETH) Keeps Going, Is 2026 the Right Time to Buy?
Projected Price Targets and Sell Zones
According to Carter, ETH/BTC is now completing its last consolidation phase within the wedge. As a result, breakout signals are beginning to emerge as the price approaches resistance, and the pair maintains higher lows. If ETH/BTC confirms a breakout above the upper boundary of the wedge, Carter predicts that it will rise to an initial target of $0.041, which is in line with the previous consolidation area.
Further, the price could go up to $0.051 and $0.060. The final upside target is set at $0.081, which coincides with a broader resistance zone on the chart. Analysts marked this resistance as a sell zone, indicating when traders can start taking profits.
Critical Support Levels for ETH/BTC
In his analysis, Carter also identified several support zones that could act as key defense levels if Ethereum experiences a pullback against Bitcoin. The first major support zone is located near the upper boundary of the Broadening Wedge pattern, around $0.031. Below that, analysts have determined another support level at $0.026. If the price drops below $0.026, the next important support is around $0.022, which represents a drop of around 35% from the current level above $0.034.
In a deeper correction scenario, Carter estimates that ETH/BTC could drop to $0.0185, a level marked on the chart as the “support zone” of the Broadening Wedge. Any move below this support would likely push ETH/BTC towards the lower boundary of the wedge, which stretches to $0.010.
Conclusion
By understanding the dynamics between Ethereum and Bitcoin and identifying key zones of both sell and support, investors can make more informed decisions in managing their crypto portfolios. Technical analysis such as that presented by John Carter provides valuable insights that can help in navigating this often unpredictable market.
Also Read: New Strategy in the Crypto World: 680,000 BTC Acquisition by Strategy!
Follow us on Google News to get the latest information about crypto and blockchain technology. Check Bitcoin price today, Solana price today, Pepe coin and other crypto asset prices through Pintu Market.
Enjoy an easy and secure crypto trading experience by downloading Pintu crypto app via Google Play Store or App Store now. Also, get a web trading experience with various advanced trading tools such as pro charting, various types of order types, and portfolio tracker only at Pintu Pro.
*Disclaimer
This content aims to enrich readers’ information. Pintu collects this information from various relevant sources and is not influenced by outside parties. Note that an asset’s past performance does not determine its projected future performance. Crypto trading activities are subject to high risk and volatility, always do your own research and use cold hard cash before investing. All activities of buying andselling Bitcoin and other crypto asset investments are the responsibility of the reader.
Reference
- Bitcoinist. Ethereum Ready to Breakout. Accessed on January 8, 2026