Bitcoin Holds at $91K: A Bullish Run With Storm Clouds on the Horizon?

Jakarta, Pintu News – Bitcoin’s rally journey continues, but the upside is not yet smooth. Bitcoin price has indeed broken back through an important trend support level, history suggests the potential for uptrend continuation, and short-term selling pressure has started to ease.
However, every time the price tries to go higher, there is new selling pressure. The cause is not obvious just from the price movement. There is still one group of Bitcoin holders who continue to sell when the price rises, and this could delay further gains.
Bitcoin Price Drops 0.21% in 24 Hours
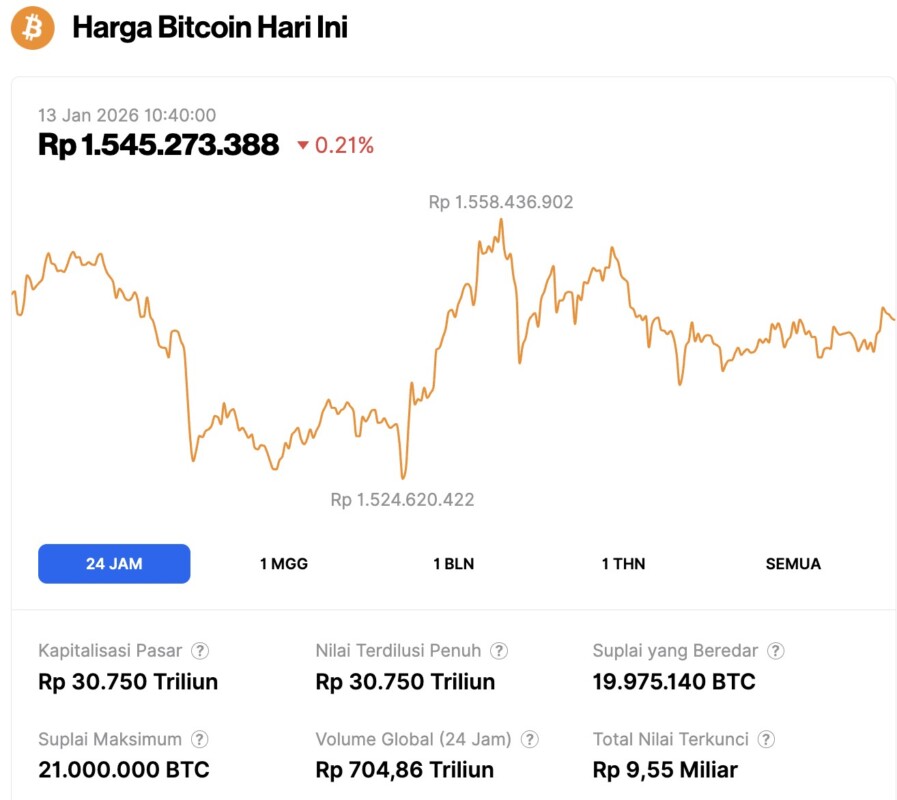
On January 13, 2026, Bitcoin was trading at $91,236, equivalent to IDR 1,545,273,388, after a slight 0.21% dip over the past 24 hours. During that period, BTC hit a low of IDR 1,524,620,422 and a high of IDR 1,558,436,902.
At the time of writing, Bitcoin’s market capitalization is approximately IDR 30,750 trillion, while its 24-hour trading volume has surged by 54%, reaching IDR 704.86 trillion.
Read also: Bitcoin vs Altcoins: Who Will Win When the Breakout Happens?
Breakout Structure Still in Place
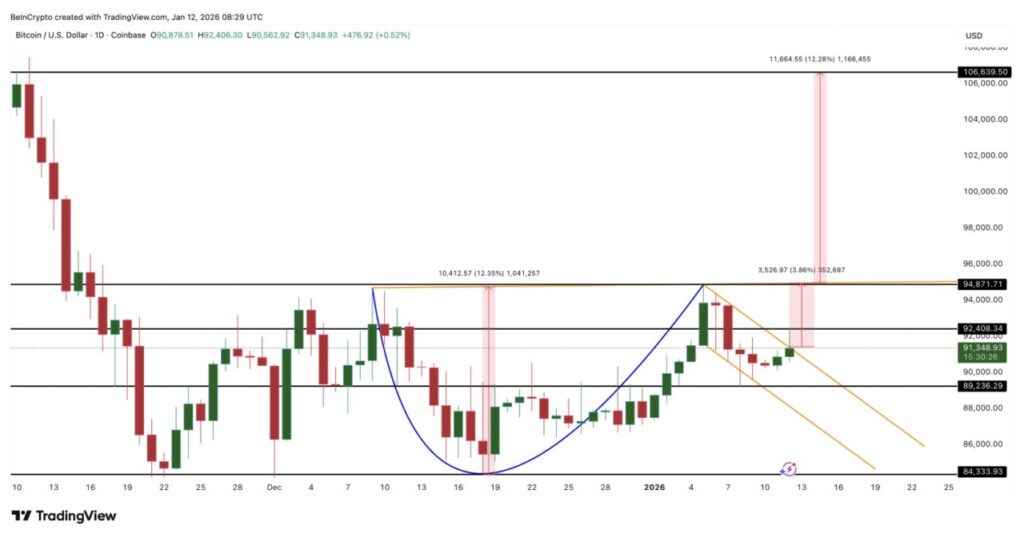
Bitcoin is currently moving in a cup and handle pattern on the daily chart. The price briefly approached the breakout point of the “handle” part around $92,400 before experiencing a correction, but the structure of this pattern is still considered valid as long as the key support levels hold.
The most important support signal right now is the 20-day EMA. EMA (Exponential Moving Average) is an exponential moving average that gives more weight to recent price movements and helps identify the direction of short-term trends.
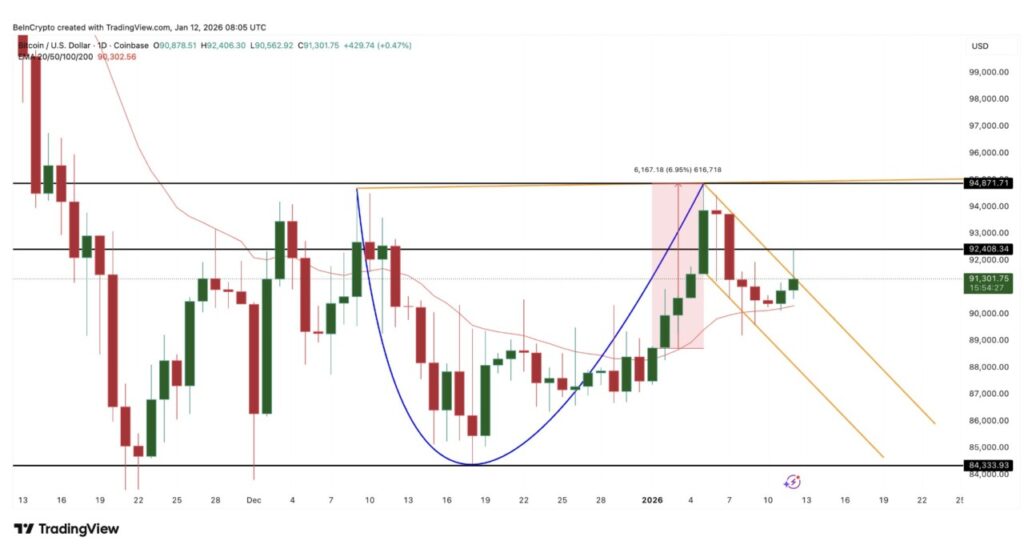
Bitcoin managed to break the 20-day EMA again on January 10, and then closed with two green daily candles. This sequence has an important meaning.
In December, Bitcoin broke back through the 20-day EMA twice – on December 3 and 9. However, both attempts failed as the next candle was red. In contrast, on January 1, after re-breaking the EMA, the next candle was also green, which then triggered a rally of almost 7%.
Currently, a similar pattern is starting to form again. As long as Bitcoin is able to stay above the 20-day EMA, the breakout scenario is still relevant. However, the presence of a long upper wick near the $92,400 level suggests that selling pressure is still present. This brings up one important question: who is still selling?
Short and Long Term Holders Tend to be Passive
On-chain data provides answers to the question of who is still selling.
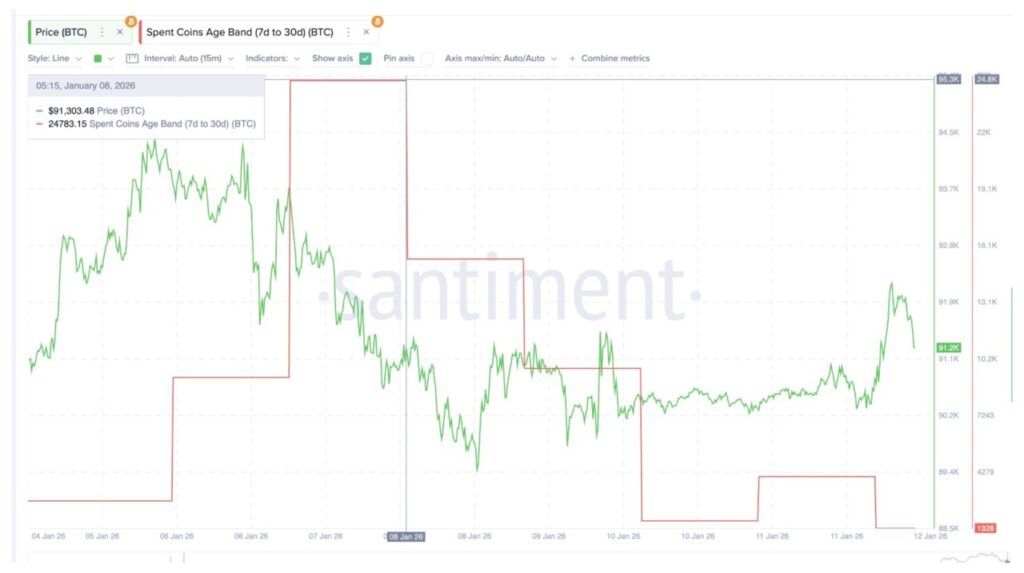
Selling pressure from short-term holders has almost disappeared. Spent Coins Age Band data – which tracks activity based on the length of time a coin has been held – shows that activity from the group holding between 7 to 30 days dropped dramatically, from around 24,800 BTC to just 1,328 BTC, or a 95% drop since January 8. This means that new buyers are not in a hurry to sell when prices rise.
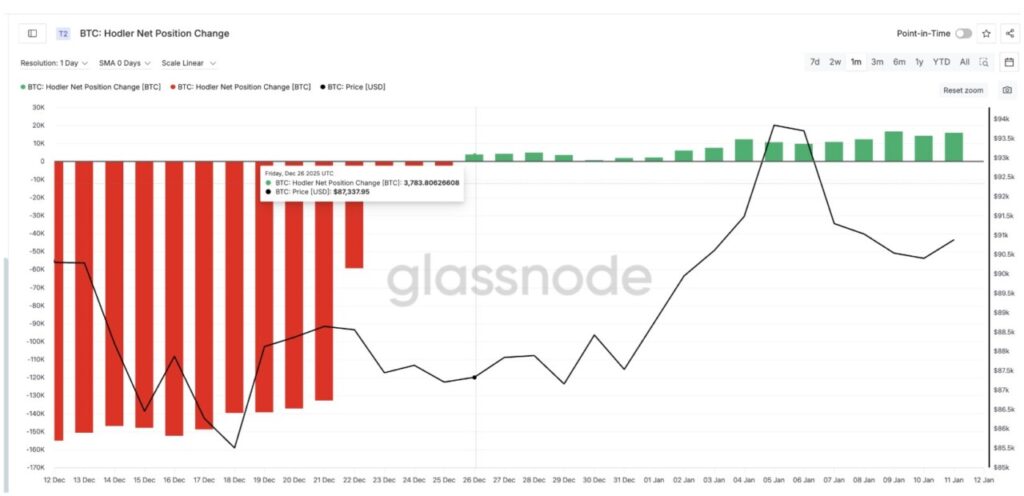
Net position change data for standard holders also shows a positive trend since December 26. This group – which is generally considered long-term investors (holding more than 155 days) – started buying again since then, and even kept buying when the Bitcoin price peaked on January 5.
However, sales are still coming from different groups.
Long-term holders’ net position change, which reflects the activity of ultra-long-term holders (who are likely to hold coins for more than a year), is still showing negative numbers. On January 1, this group distributed approximately 286,700 BTC.
As of January 11, their sales volume had dropped to around 109,200 BTC, a reduction of more than 60%. This means that the selling pressure from them has started to ease, but has not yet turned into buying.
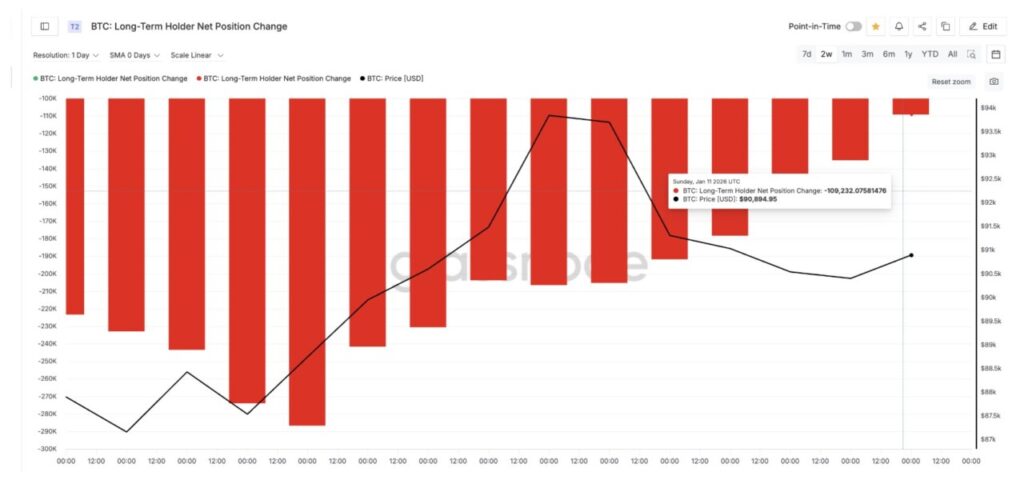
This explains why the price is still hesitating near the resistance area. Short-term sellers are gone, long-term investors are starting to buy, but ultra-long-term holders are still selling enough to limit the current price increase.
Read also: Bitcoin and XRP Price Predictions Ahead of US Supreme Court Decision!
Bitcoin Key Price Levels
Currently, Bitcoin needs to close the daily candle cleanly above $92,400 to pave the way towards the next target of $94,870. If that level is successfully broken, then the breakout scenario will be considered complete and the 12% technical upside target will be active. This target points to the area around $106,630.
For this to happen, Bitcoin needs to stay above the 20-day EMA and prevent selling pressure from ultra-long-term holders from pushing the price back down.
On the downside, the $89,230 level is an important support. A daily close below this level will weaken the breakout structure. If the price drops deeper to around $84,330, then the overall bullish setup will be considered void.
For now, the Bitcoin breakout narrative is still on track. The only element still lacking is the conviction of the ultra-long term holders. If this group stops selling, the pending breakout could happen quickly.
That’s the latest information about crypto. Follow us on Google News to get the latest crypto news about crypto projects and blockchain technology. Also, learn crypto from scratch with complete discussion through Pintu Academy and stay up-to-date with the latest crypto market such as bitcoin price today, xrp coin price today, dogecoin and other crypto asset prices through Pintu Market.
Enjoy an easy and secure crypto trading experience by downloading Pintu crypto app via Google Play Store or App Store now. Also, get a web trading experience with various advanced trading tools such as pro charting, various types of order types, and portfolio tracker only at Pintu Pro.
*Disclaimer
This content aims to enrich readers’ information. Pintu collects this information from various relevant sources and is not influenced by outside parties. Note that an asset’s past performance does not determine its projected future performance. Crypto trading activities have high risk and volatility, always do your own research and use cold cash before investing. All activities of buying and selling bitcoin and other crypto asset investments are the responsibility of the reader.
Reference:
- BeInCrypto. Bitcoin’s 12% Breakout Story Lives – But One Group Is Trying To Spoil The Ending? Accessed on January 13, 2026


