RENDER Price Surges Past $2 — Can the Bulls Keep Up the Momentum?
Jakarta, Pintu News – After being under pressure for several weeks, Render – the native token that powers a decentralized GPU network – has started to show better performance as real-world interest in decentralized rendering increases.
After breaking through the $1.40 level, the price of RENDER increased rapidly and jumped more than 30% in just one week. This sharp price surge turned the $2 resistance level into a support level, and the major EMA indicators began to show a bullish trend.
As Render continues to hold at around $2, its price structure appears to be forming a pattern that could open up an opportunity to break the next resistance level at $3.
Let’s take a deeper dive into the market structure and the on-chain indicators that could determine the direction of the next move.
Render Price Structure Shows Potential Trend Shift
After months of decline in a falling channel pattern, the price of RENDER finally managed to break out of its long-term downward trend and reclaim the $2 level.
Read also: Analyst Peter Brandt Reveals the Potential for Monero (XMR) to Print a Silver-like “God Candle”
This move wasn’t just an ordinary bounce, as Render prices surged through the 20, 50, and 100-day EMA lines – indicating accumulation by market participants.
As of January 12, the price of Render (RENDER) was trading at $2.57, recording a daily gain of over 12%, making it one of the best performing assets among AI and Big Data-based coins.
Furthermore, Render prices have risen by more than 60% in early 2026, signaling increased buying interest and improving market sentiment.
The structure of the RENDER price chart shows signs of a trend reversal, where buying pressure is starting to dominate and a pattern of higher highs and higher lows is starting to form. Momentum indicators also support this bullish view. The daily RSI has broken the neutral 50 mark and continues to rise towards overbought territory.
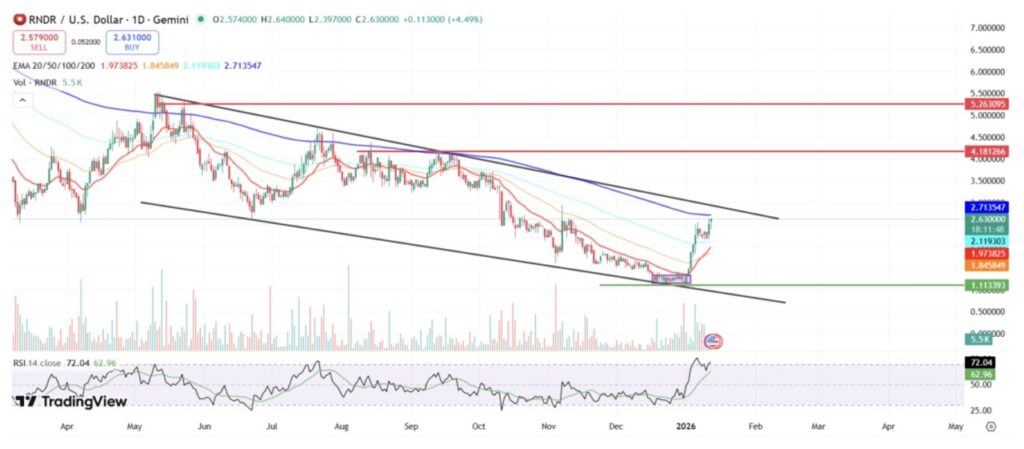
In addition, the Chaikin Money Flow (CMF) indicator turned positive, indicating increased capital flow into Render assets. The On-Balance Volume (OBV) indicator has also started to move up, which reinforces the signal of gradual accumulation.
On-Chain Data Leads to Bullish Signals as Buyers Move In
On-chain data also reinforces the bullish scenario for Render. Based on data from Coinglass, Render’ s liquidation heatmap shows a positive outlook among open long and short positions.
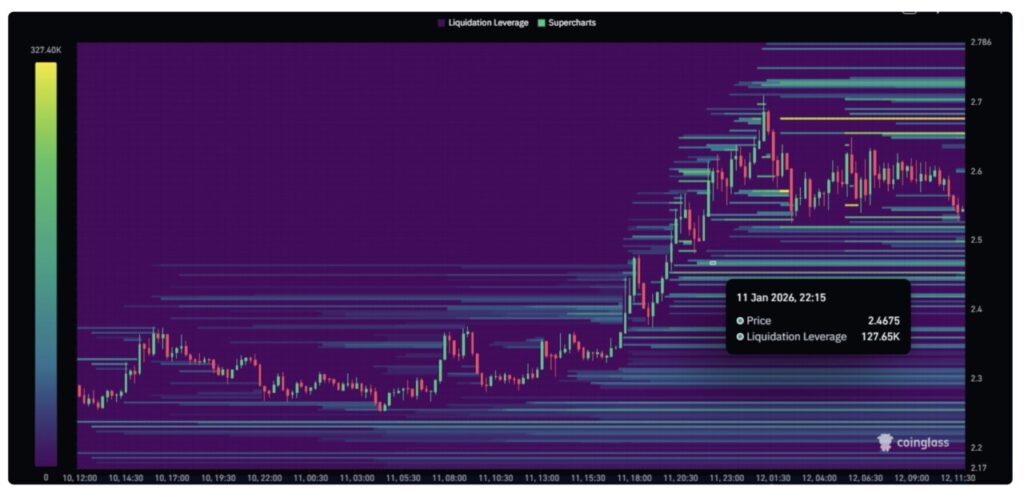
A $100,000 liquidation was recorded around the $2.40 level, while the next liquidity pool is around $3 – which could be a trigger for further price increases.
In addition, Open Interest (OI) also saw a gradual rise during the week. At the time of writing, OI jumped over 27% to $76.2 million, reflecting increased buying interest from market participants.
Read also: 1 Pi Network (PI) Price in Indonesia Today
Conditions to Continue the Bullish Trend
For RENDER prices to truly confirm a trend reversal, bulls must be able to turn the $3 resistance level into new support. A strong price close above this area would confirm a breakout from the channel pattern and could push RENDER prices to the next target in the $4 to $5 range.
However, if the price fails to hold above the key level of $2.20, then a re-consolidation phase is likely, with a potential retest to the previous lows of $2 and $1.60 in the next few sessions.
Until a clear breakout occurs, RENDER is still in a transition phase from recovery to trend reversal.
That’s the latest information about crypto. Follow us on Google News to get the latest crypto news about crypto projects and blockchain technology. Also, learn crypto from scratch with complete discussion through Pintu Academy and stay up-to-date with the latest crypto market such as bitcoin price today, xrp coin price today, dogecoin and other crypto asset prices through Pintu Market.
Enjoy an easy and secure crypto trading experience by downloading Pintu crypto app via Google Play Store or App Store now. Also, get a web trading experience with various advanced trading tools such as pro charting, various types of order types, and portfolio tracker only at Pintu Pro.
*Disclaimer
This content aims to enrich readers’ information. Pintu collects this information from various relevant sources and is not influenced by outside parties. Note that an asset’s past performance does not determine its projected future performance. Crypto trading activities have high risk and volatility, always do your own research and use cold cash before investing. All activities of buying and selling bitcoin and other crypto asset investments are the responsibility of the reader.
Reference:
- Coinpedia. Render Price Holds Above $2 as Sell Pressure Fades, Can Bulls Sustain the Rally? Accessed on January 13, 2026


