XRP Price Prediction: $1.80 Support Holds Strong Amid 184% Surge in Trading Volume
Jakarta, Pintu News – The price of XRP briefly traded around $1.8755 on January 26 after bouncing off the $1.80 demand zone that has been a correction buffer area since October. This recovery was accompanied by a significant spike in trading volume, suggesting that traders consider this level to be a crucial point for determining the direction of the next move.
Volume Explodes at Critical Support Point
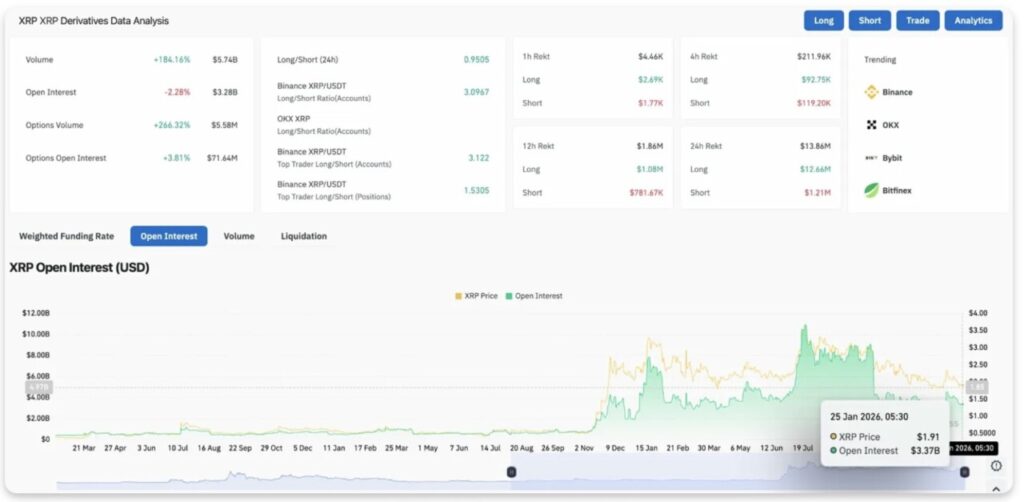
Trading activity surged as prices tested the $1.80 floor. Futures trading volume increased sharply by 184.16% to $5.74 billion-one of the biggest daily spikes in recent weeks. Options volume rose even more dramatically, by 266.32% to $5.58 million.
Read also: When is the Best Time to Buy XRP? Here’s ChatGPT’s Analysis
This surge in volume at the established support area shows that both buyers and sellers are actively engaged. The bullish side is trying to defend this level, while the bearish side is trying to force a decline. A contested zone like this will usually result in a sharp move once one side runs out of steam.
Spot Flow Negative Despite Price Bounce
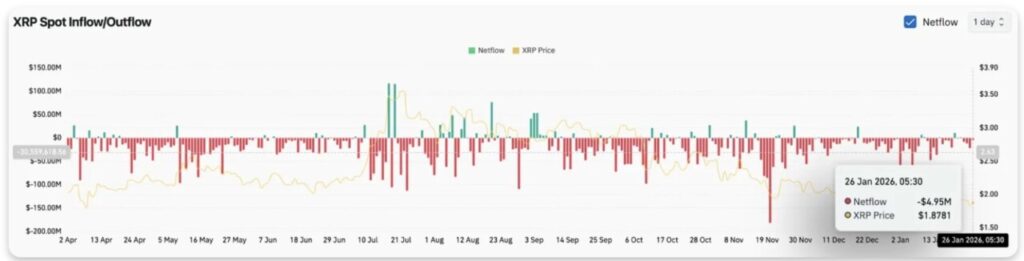
Flow data on exchanges suggests selling pressure is hidden behind the price bounce. Coinglass recorded a net outflow of $4.95 million on January 26, meaning the coins moved to exchanges instead of being held in private wallets.
The direction of this flow is against the rising price, indicating that some holders are taking advantage of the rally to reduce exposure. When spot flow is contrary to price action, it usually creates conditions for a retest of the level being defended.
This outflow comes after several days of positive flow earlier in the same week. This reversal could be a sign that confidence in the $1.80 support level is starting to weaken among large holders, although prices are still trying to hold.
Derivatives Show Aggressive Positioning
Open interest decreased by 2.28% to $3.28 billion as volatility forced the liquidation of leveraged positions. In the last 24 hours, there was a $12.66 million liquidation of long positions, much larger than the $1.21 million in short positions-a ratio of 10:1 in favor of the bearish side.
This predominance of long liquidations suggests that leveraged bullish traders got caught out when the price dropped towards $1.80. This forced liquidation does reduce selling pressure from the less confident side, but it also signals that buying conviction is starting to weaken.
The long/short ratio stands at 0.95, slightly favoring short positions. However, top traders on Binance recorded a long/short ratio of 3.09, suggesting that large accounts are still positioning themselves for a recovery despite retail traders starting to throw in the towel.
Open interest in options rose 3.81% to $71.64 million, confirming that traders are still actively positioning themselves for the next move, rather than withdrawing from the market.
$1.80 Support Tested for the Fifth Time
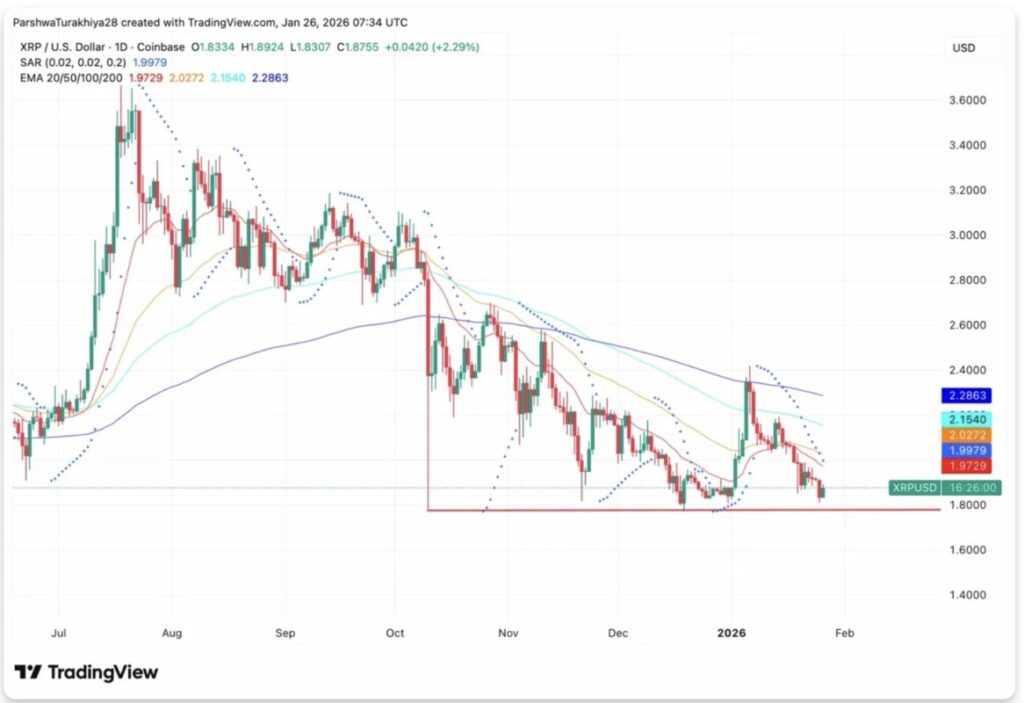
On the daily chart, XRP has tested the $1.80 horizontal support five times since October. Each time, this level has attracted buying interest, but the frequency of these repeated tests indicates that the support strength is starting to weaken.
The price is currently below all four EMAs, confirming the bearish market structure:
- Immediate resistance: $1.9729 (EMA 20)
- SAR resistance: $1.9979
- Secondary resistance: $2.0272 (EMA 50)
- Major resistance: $2.1540 (100 EMA)
- Trend resistance: $2.2863 (EMA 200)
- Critical support: $1,80
- Target breakdown: $1,60
Read also: Ethereum Price Prediction: Network Growth Promises $4,800 Target?
The Parabolic SAR is at $1.9979, slightly above $2.00. If the price closes above this level, the indicator will turn bullish and signal a shift in momentum.
Intraday Momentum Begins to Improve
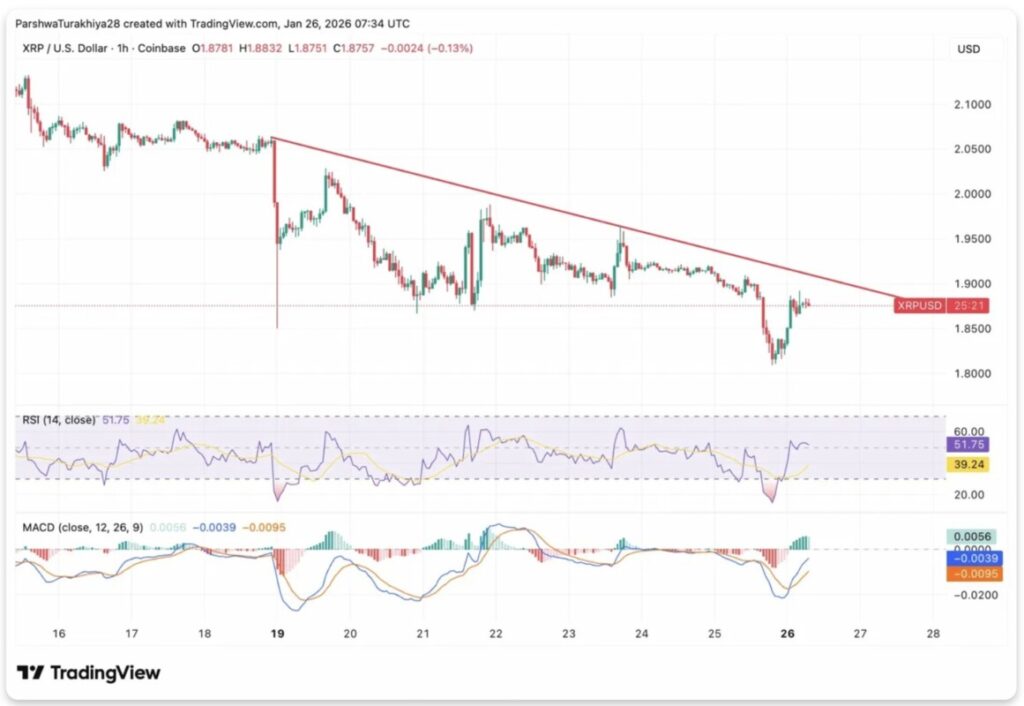
In the shorter time frame, the dynamics of the price bounce are starting to show. On the hourly chart, XRP has recovered from a low of $1.83 and formed a possible higher low above the downtrend line.
The RSI indicator rose to 51.75 levels, surpassing the neutral point of 50 for the first time since the selling pressure started. Meanwhile, the MACD showed a potential bullish crossover, with the histogram turning positive.
The downtrend line from the January high is now in the range of $1.90 to $1.92. If the price manages to break above this area, it will confirm that the short-term momentum has turned bullish and open up opportunities to test the $2.00 level.
Follow us on Google News to stay up to date with the latest in crypto and blockchain technology. Check Bitcoin price, usdt to idr and tokenized nvidia stock price through Pintu Market.
Enjoy an easy and secure crypto trading experience by downloading the Pintu crypto app via Play Store or App Store now. Also, experience web trading with advanced trading tools such as pro charting, various types of order types, and portfolio tracker only at Pintu Pro.
*Disclaimer
This content aims to enrich readers’ information. Pintu collects this information from various relevant sources and is not influenced by outside parties. Note that an asset’s past performance does not determine its projected future performance. Crypto trading activities are subject to high risk and volatility, always do your own research and use cold hard cash before investing. All activities of buying and selling Bitcoin and other crypto asset investments are the responsibility of the reader.
Reference:
- CoinEdition. XRP Price Prediction: $1.80 Support Holds As Volume Explodes 184% On Bounce Attempt. Accessed on January 27, 2026


