Bitcoin Holds Near $88,000 as Traders Set Their Sights on $93,500 Liquidation Zone

Jakarta, Pintu News – Bitcoin briefly surged to $90,600 on January 28, 2026, but the gains evaporated immediately after the US Federal Reserve announced its decision not to cut interest rates. Despite the wild price movements of Bitcoin, data shows that traders are still eyeing a potential rise to $93,500.
One analyst stated that this price level is an important liquidation zone, with over $4 billion of leveraged short positions at risk of liquidation.
Bitcoin Price Drops 0.83% in 24 Hours
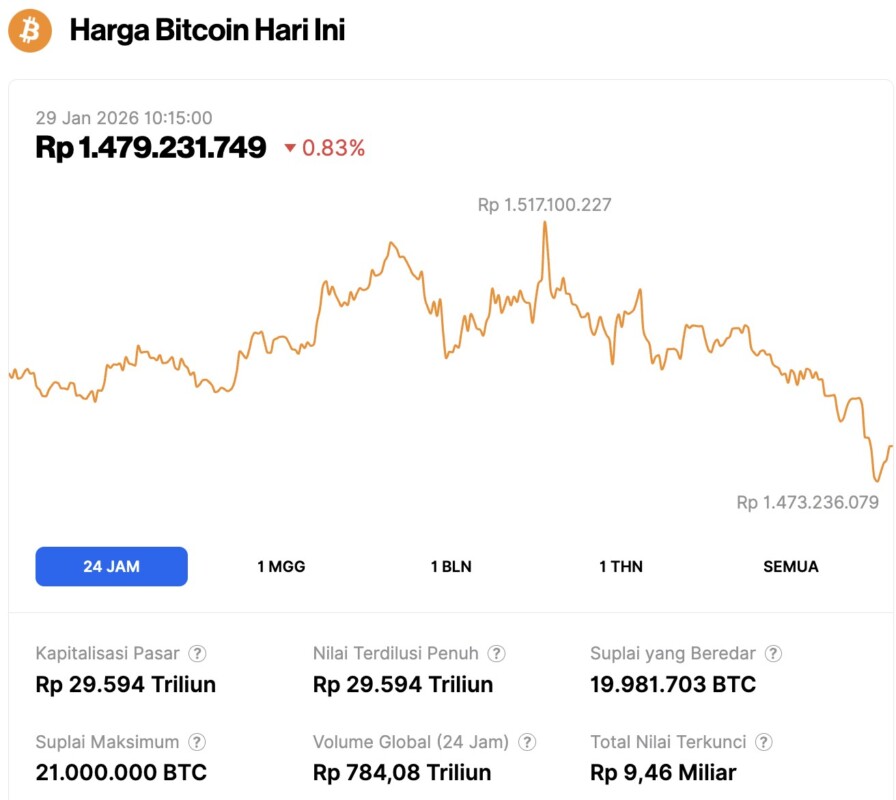
On January 29, 2026, Bitcoin was trading at $88,042, or approximately IDR 1,479,231,749, marking a slight 0.83% dip over the past 24 hours. During that time, BTC touched a low of IDR 1,473,236,079 and reached a high of IDR 1,517,100,227.
As of this writing, Bitcoin’s market capitalization is around IDR 29,594 trillion, while its 24-hour trading volume has climbed 10% to IDR 784.04 trillion.
Read also: Jerome Powell’s Speech Today: Bitcoin & Altcoins Prepare for Fed Rate Cut!
Potential Short Liquidation Makes $93,500 a Bitcoin Price Target
According to crypto trader Mark Cullen, the $93,500 level is a striking point on the Bitcoin liquidation map on exchanges. Cullen said that this price zone gives a clear “Come after me!” signal, with the liquidation level standing out like a “swollen thumb.”
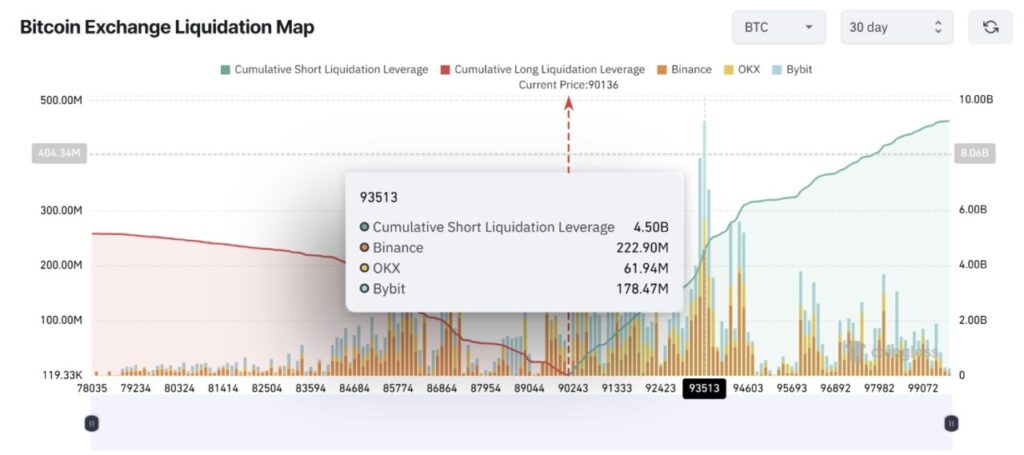
Data from CoinGlass shows that there is an accumulation of $4.5 billion worth of short positions around the $93,500 level. If Bitcoin breaks out of this range, then forced liquidation could accelerate the price movement, turning a slow rally into a quick spike triggered by the closing of short positions.
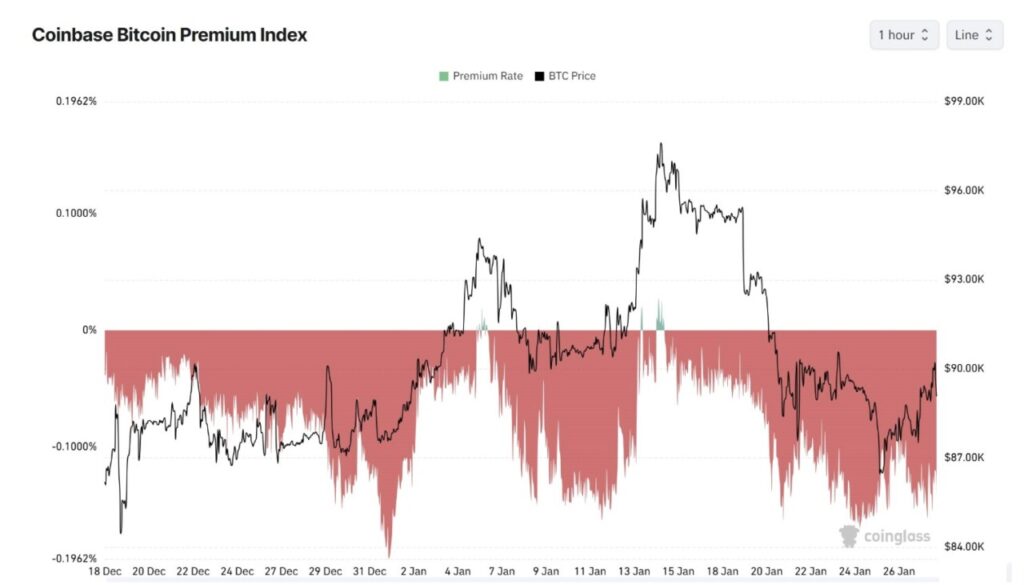
However, underlying market participation is still uneven. Coinbase’s Bitcoin premium index – which tracks spot demand in the US through the exchange – is still in deep negative territory. This indicates that the current rally is being driven more by futures trading and leverage, rather than by strong spot buying from US investors.
Read also: Donald Trump Hints at Announcing New Fed Chair Soon and Promises Interest Rate Cuts!
“Risk-off” signals still active despite price rebound
Crypto analyst Leo Ruga highlighted that both the Composite risk oscillator (which includes SPX, gold, crude oil, and DXY) against BTC and the onchain stress oscillator are currently both in “risk-off” territory.
The risk oscillator is currently at around 52, while onchain pressure remains high above the 34 level – these numbers reflect market pressure more than trend expansion.
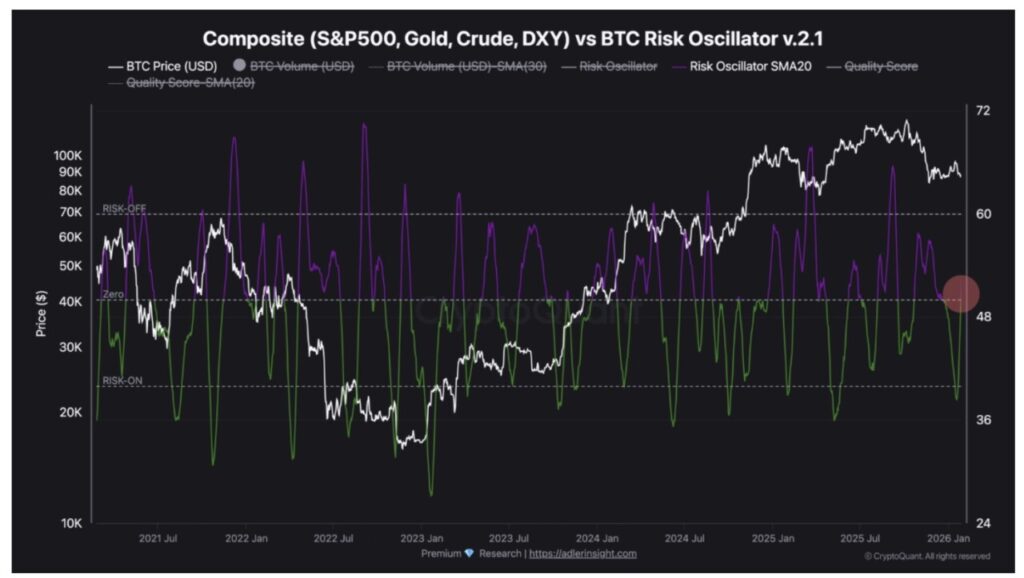
Ruga emphasized that for a sustained recovery to occur, the selling pressure must subside. Until that happens, the strong bullish trend is unlikely to last long.
Meanwhile, analyst Pelin Ay said that the Whale Ratio gives a neutral to cautious signal, rather than a clear accumulation signal. Currently, the ratio is around its 100-day moving average, but still well below extreme levels.
This indicates that whales are not selling, but also not taking positions to push prices higher. Without a decisive move in the Whale Ratio, market volatility is likely to remain high with no clear direction.
Follow us on Google News to stay up to date with the latest in crypto and blockchain technology. Check Bitcoin price, usdt to idr and tokenized nvidia stock price through Pintu Market.
Enjoy an easy and secure crypto trading experience by downloading the Pintu crypto app via Play Store or App Store now. Also, experience web trading with advanced trading tools such as pro charting, various types of order types, and portfolio tracker only at Pintu Pro.
*Disclaimer
This content aims to enrich readers’ information. Pintu collects this information from various relevant sources and is not influenced by outside parties. Note that an asset’s past performance does not determine its projected future performance. Crypto trading activities are subject to high risk and volatility, always do your own research and use cold hard cash before investing. All activities of buying and selling Bitcoin and other crypto asset investments are the responsibility of the reader.
Reference:
- Cointelegraph. Bitcoin traders eye $93.5K liquidation sweep despite Fed interest rate pause. Accessed on January 29, 2026


