3 Altcoins Catching Crypto Whales’ Attention in February 2026: Time to Buy or Let Go?

Jakarta, Pintu News – Privacy coins were one of the standout winners in 2025, but 2026 has not been as good so far. Some coins that were previously in the lead experienced sharp corrections, while new names showed volatile price bounces.
As February begins, crypto whales are no longer betting haphazardly. Instead, they are now buying and selling these three privacy coins selectively, based on momentum changes, early reversal signals, and chart structures that could determine the direction of the next move-both up and down.
Zcash (ZEC)
Zcash has been one of the strongest privacy coins over the past year, but its momentum has weakened dramatically ahead of 2026. In the past month alone, the price of ZEC fell by almost 26%, reflecting the market’s risk-averse attitude. However, this weakness is starting to show signs of change as February approaches.
Read also: 5 Reasons Why Bitcoin Price Could Plummet This Week
On January 28, large investors (whales) began a massive buying spree. Standard Zcash whales increased their holdings by 45.19%, bringing their total balance to around 14,500 ZEC.
Simultaneously, the 100 largest addresses also increased their exposure by 14.6%, with total combined holdings rising to 43,722 ZECs.
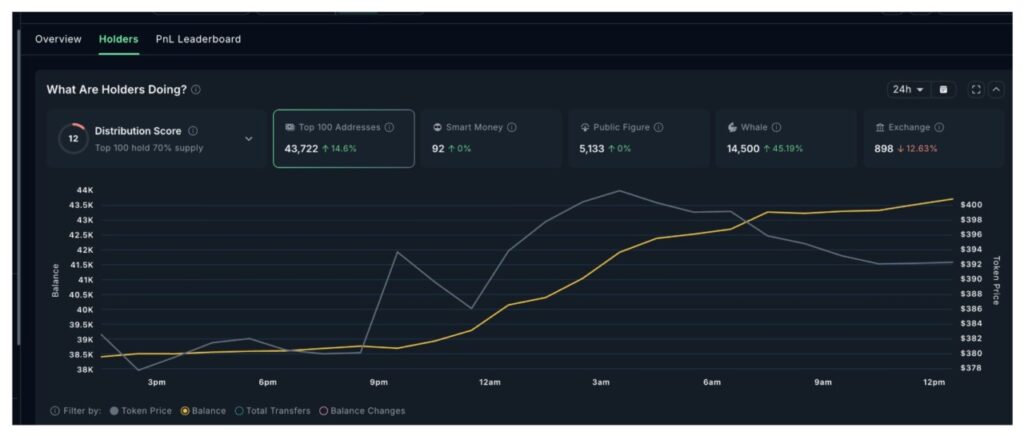
In total, the whales added about 6,500 ZEC, which is equivalent to about $2.5 million based on current prices. ZEC balances on exchanges also decreased during this period, indicating that the action was an accumulation rather than a distribution.
The price chart shows the reason behind the current whale action. Since late December, ZEC has been trading in a bear flag pattern, which is a bear continuation pattern that indicates a potential further decline of 42%. However, that risk is now being questioned. Zcash has started to break the upper trendline of the bear flag pattern, which weakens the structure of the decline.
Momentum indicators also support this change. Between October 30 and January 25, the ZEC price formed higher lows, while the Relative Strength Index (RSI) indicator formed lower lows.
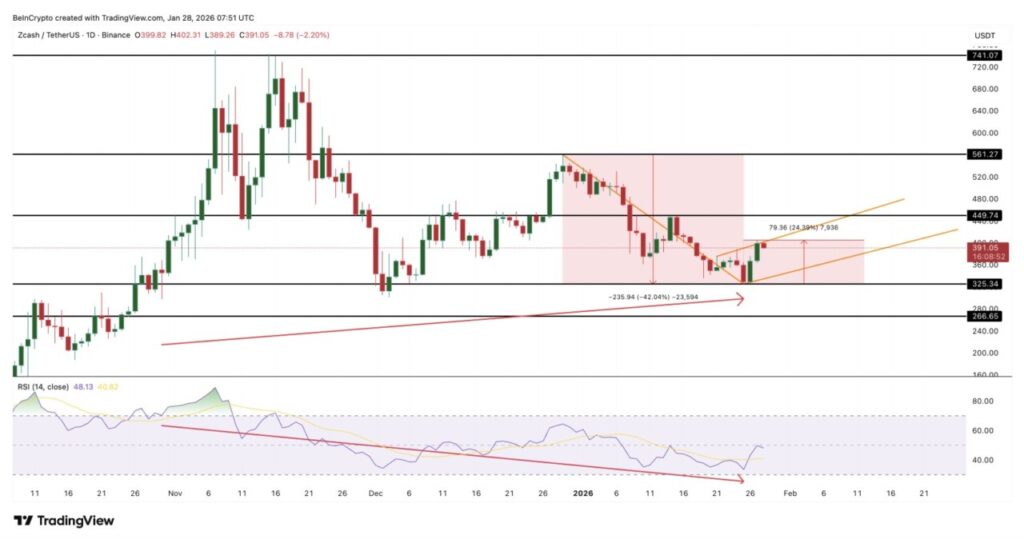
The RSI measures the strength of momentum, and this discrepancy is called a hidden bullish divergence-a signthat selling pressure is starting to weaken behind the scenes. Since the signal appeared, the price of ZEC has risen by about 24%.
The next key level is $449. If the price is able to break this level convincingly, then the majority of the bear flag pattern will fall, opening up a potential upside towards $561-the point where the bearish structure completely collapses.
However, if the price drops below $325, then the downside risks will return and the bullish scenario of the whale action will become invalid.
Dusk (DUSK)
Among other privacy coins, Dusk Network stands out for one reason: its whale behavior. The price of DUSK is still up almost 200% in the last 30 days, likely triggered by the FOMO action of investors who missed the DASH and XMR rallies. However, in the last seven days, DUSK has corrected more than 38%, creating a sharp divergence among the group of coin holders ahead of February.
On-chain data shows that small whales reduced holdings, while large players took the opposite position during this downturn.
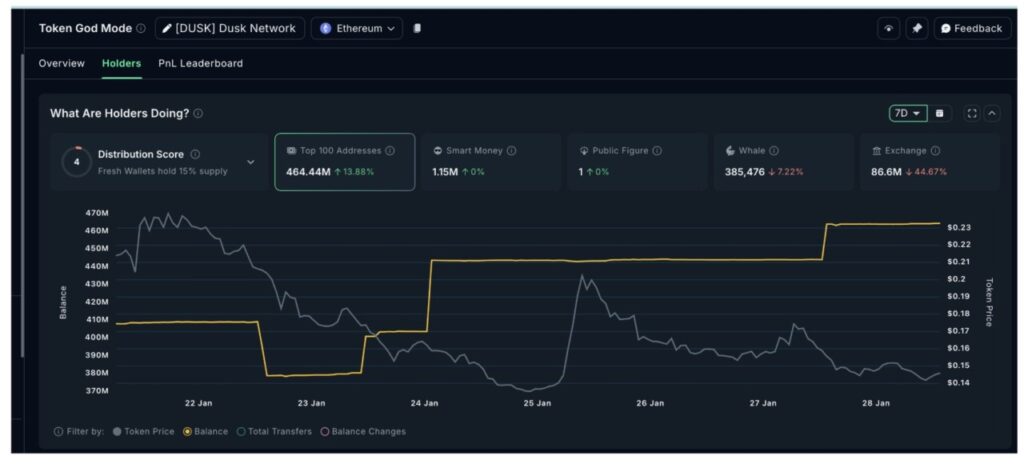
Standard whale wallets reduced their holdings by 7.22% during the correction. In contrast, the top 100 addresses increased the amount of DUSK they held by 13.88%, to a total of 464.44 million DUSK. This means that around 56.6 million DUSK was added by mega whales during the downturn, equivalent to around $8.2 million based on current prices.
This difference in attitude makes sense if you look at the graph.
DUSK is forming an inverse head-and-shoulders pattern, but theneckline of this pattern is sloping downward, which makes a breakout more difficult.
The crucial resistance zone is between $0.176 to $0.190. A daily close above $0.190 would confirm the pattern and open up an upside potential of around 68%, with targets to the $0.321-$0.330 area.
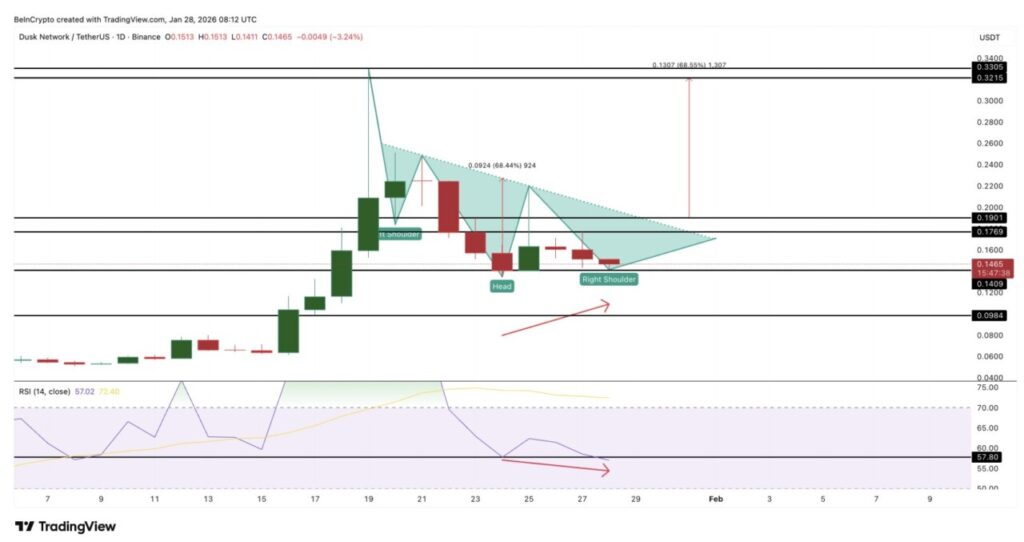
Momentum signals are still early, but are starting to show improvement. Between January 24 to 28, the price tried to form a higher low, while the RSI actually printed a lower low, signaling a hidden bullish divergence.
However, this pattern is only valid if the price remains above $0.140. If the price drops below that level, the divergence signal will fall and DUSK could be in danger of dropping to around $0.098.
Read also: Altcoin season could start in the next 112 days? Here’s why
In short, the privacy coin whales are still at odds over DUSK. Small holders tend to reduce risk after sharp corrections, while mega whales buy amid weakness, anticipating a potential breakout from the pattern formed.
As long as the price has not managed to break $0.190, DUSK is still classified as a high-risk asset with an unconfirmed trend.
COTI
Among other privacy coins, COTI has quietly entered a correction phase. The token is down about 22% in the past month and 14% in the past seven days, reflecting continued pressure in adescending channel pattern. But behind that weakness, whale behavior suggests that the selling phase may be starting to slow down.
On-chain data shows a clear shift. Since January 13, COTI whales reduced holdings significantly, from 733.46 million COTI to a low of 718.17 million.
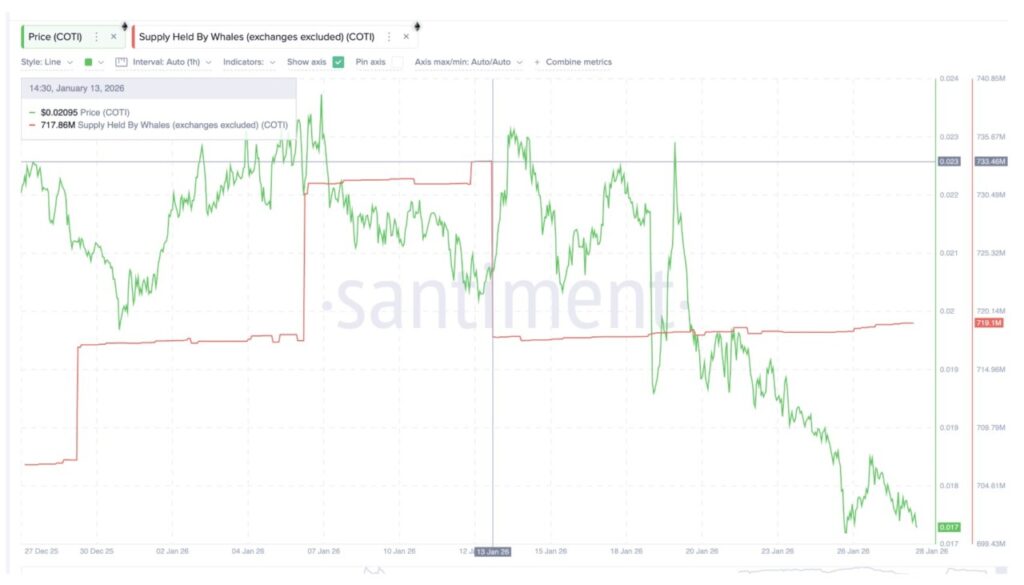
This distribution is in line with the breakdown risk of the channel pattern and explains why prices remained weak until mid-January. However, the trend is now starting to change.
Since January 22, the whales started buying again, increasing their holdings from 718.17 million to 719.1 million COTI-an increase of about 930,000 COTI.
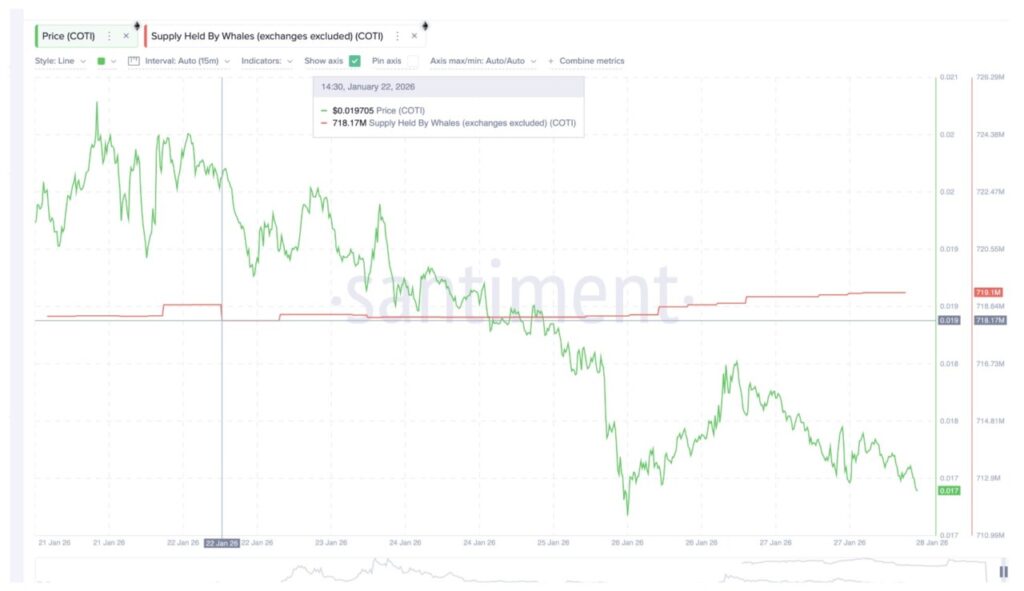
These purchases are still relatively small compared to previous sell-offs, which is important to note. This means that this is the first step of an accumulation position, not a full conviction.
COTI’s price chart explains the reason behind the cautious yet interested attitude of the whales. Although it is still in a downward channel, the momentum indicator is starting to show a change.
Between November 4 and January 25, the price printed lower lows, while the RSI printed higher lows. This kind of bullish divergence usually indicates that selling pressure is starting to weaken, even though the prices haven’t actually reversed. This kind of pattern is often an early signal of a trend reversal.
However, for this signal to be valid, the price has to break a certain level. A daily close above $0.019 would be the first test. If successful, this opens the door to $0.024-a potential 40% increase that would neutralize the current bearish structure.
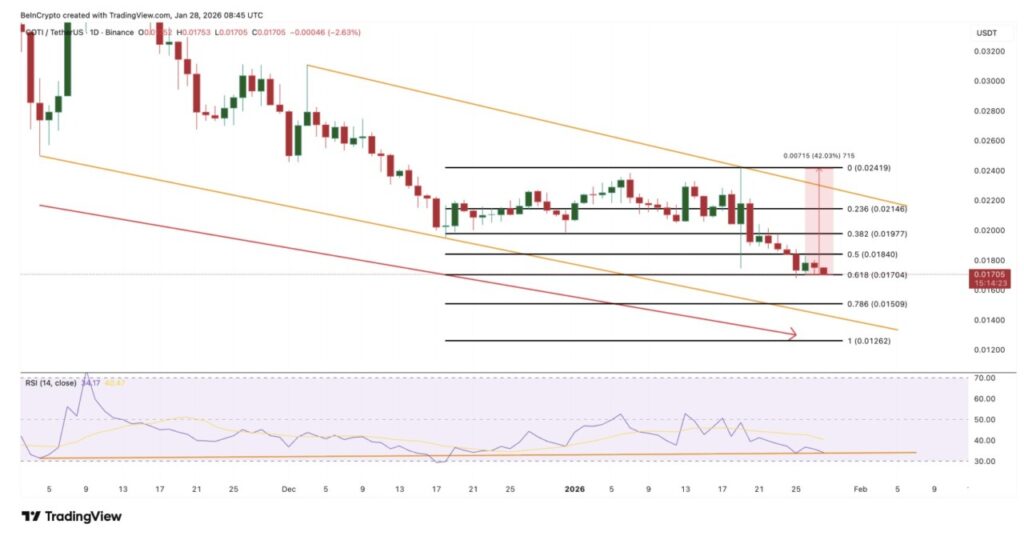
Until that happens, the downside risk remains. If the price falls below $0.015, then the divergence formation time could be longer and open up the potential for a deeper drop.
Follow us on Google News to stay up to date with the latest in crypto and blockchain technology. Check Bitcoin price, usdt to idr and tokenized nvidia stock price through Pintu Market.
Enjoy an easy and secure crypto trading experience by downloading the Pintu crypto app via Play Store or App Store now. Also, experience web trading with advanced trading tools such as pro charting, various order types, and portfolio tracker only at Pintu Pro.
*Disclaimer
This content aims to enrich readers’ information. Pintu collects this information from various relevant sources and is not influenced by outside parties. Note that an asset’s past performance does not determine its projected future performance. Crypto trading activities are subject to high risk and volatility, always do your own research and use cold hard cash before investing. All activities of buying and selling Bitcoin and other crypto asset investments are the responsibility of the reader.
Reference:
- BeInCrypto. 3 Privacy Coins Crypto Whales are Buying and Selling Ahead of February 2026. Accessed on January 30, 2026


