Ethereum Drops to $2,700 as Fund Outflows and Metal Rally Weigh on Market

Jakarta, Pintu News – The price of Ethereum briefly hovered around $2,922 on January 29, after falling through the psychological $3,000 level for the first time since mid-January. This decline was due to massive outflows in the spot market and a continued shift to precious metals, where gold prices are up 18 percent and silver has jumped 52 percent since the beginning of the year.
Currently, ETH is nearly 40 percent below its October highs, while traditional safe haven assets continue to set record highs.
Ethereum Price Drops 7.19% in 24 Hours
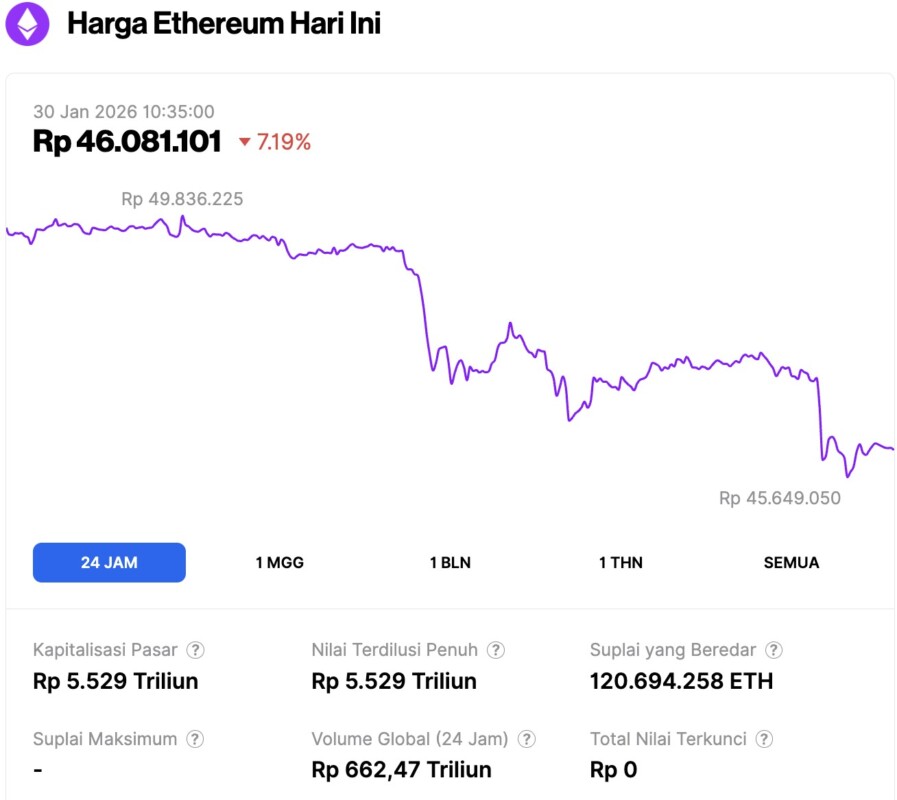
As of January 30, 2026, Ethereum was trading at approximately $2,733, equivalent to IDR 46,081,101—marking a 7.19% drop over the past 24 hours. Within that same period, ETH dipped to a low of IDR 45,649,050 and climbed to a high of IDR 49,836,225.
At the time of writing, Ethereum’s market capitalization is estimated at around IDR 5,529 trillion, while its 24-hour trading volume has surged by 84% to reach IDR 662.47 trillion.
Read also: Bitcoin Price Plunges Sharply to $82,000 Today: 50-Day EMA Stagnates, Gold & Dollar Dominate!
Precious Metals Rally Creates Capital Vortex
The current macro environment remains inhospitable to risky assets. Gold prices are trading above $5,267 after rising 1.52 percent in one session, while silver broke $112 with a 5.94 percent gain.
This strength in precious metals creates what analysts call a “capital vortex,” drawing attention and fund flows away from crypto and other growth-based investment themes.
Fundstrat’s Tom Lee recognized this dynamic on Wednesday, suggesting that investors remain focused on structurally strong ideas despite the fear of being left behind by a metals rally. BitMine also voiced a similar view, calling Ethereum the future of finance, but warning that the gold and silver rallies could pull capital away from long-term opportunities.
The turnover of funds is evident. While precious metals are attracting new buyers, Ethereum is experiencing distribution, both on the spot market and through ETF channels.
Spot Outflows Reach $177 Million, Sales Increase
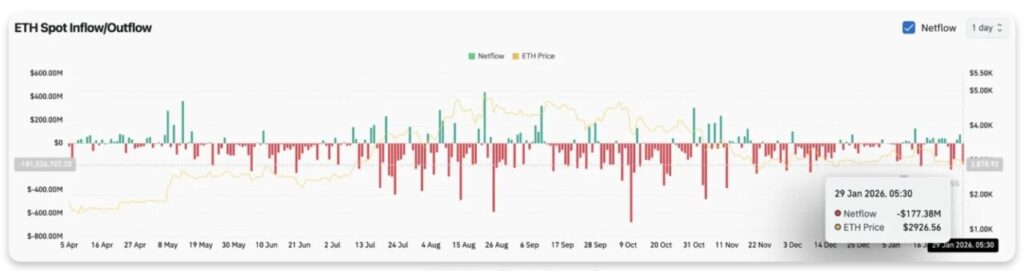
Data from Coinglass shows a net outflow of $177.38 million on January 29, making it one of the largest distribution days since early January. This movement indicates that ETH holders are sending their assets to exchanges for sale, rather than adding to their holdings at current price levels.
This outflow pattern continued throughout the month. When spot flows remain negative as the price declines, it indicates conviction on the part of sellers, not just a temporary repositioning. The lack of buying action to absorb supply leaves ETH prices vulnerable to further declines.
Read also: Altcoin season could start in the next 112 days? Here’s why
Decline Below EMA Turns Structure Bearish
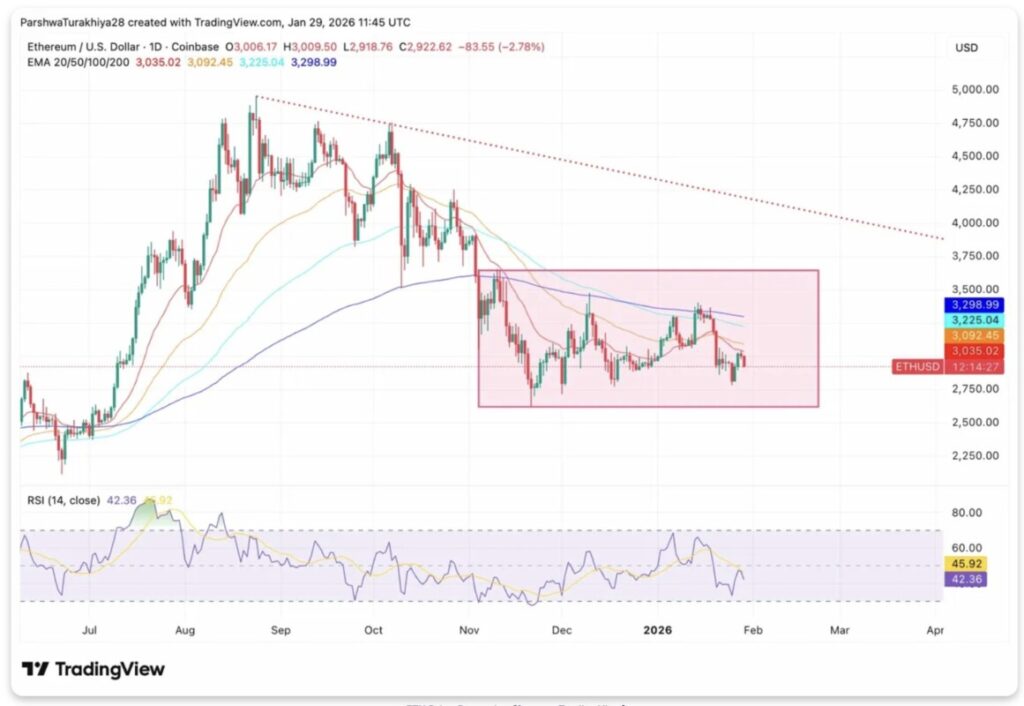
On the daily chart, Ethereum is trading below all four major Exponential Moving Averages (EMAs). The 20-day EMA is at $3,035, the 50-day EMA is at $3,092, the 100-day EMA is at $3,225, and the 200-day EMA is at $3,298. This stack of resistance levels creates a “price ceiling” that sellers have been successfully defending since mid-January.
The consolidation range from November to January between $2,800 and $3,500 has now been broken to the downside. Prices briefly touched $3,500 in early January before reversing sharply, and the failure to maintain levels above $3,000 confirms that control is still in the hands of sellers.
The RSI indicator is at 42.36, indicating weakening momentum but has not yet entered the oversold zone. There is still room for the RSI to drop further before it reaches the level that usually attracts buyers when the price weakens (dip buyers).
Important levels to note include:
- Immediate resistance at $3,035 (20-day EMA)
- Key resistance between $3,092 to $3,298 (another set of EMAs)
- Support at $2,800 (November low)
- Deeper demand area around $2,500 if the current structure fails to hold.
Follow us on Google News to stay up to date with the latest in crypto and blockchain technology. Check Bitcoin price, usdt to idr and tokenized nvidia stock price through Pintu Market.
Enjoy an easy and secure crypto trading experience by downloading the Pintu crypto app via Play Store or App Store now. Also, experience web trading with advanced trading tools such as pro charting, various order types, and portfolio tracker only at Pintu Pro.
*Disclaimer
This content aims to enrich readers’ information. Pintu collects this information from various relevant sources and is not influenced by outside parties. Note that an asset’s past performance does not determine its projected future performance. Crypto trading activities are subject to high risk and volatility, always do your own research and use cold hard cash before investing. All activities of buying and selling Bitcoin and other crypto asset investments are the responsibility of the reader.
Reference:
- CoinEdition. Ethereum Price Prediction: ETH Drops Below $3k as $177M Outflows & Metals Rally Pull Capital Away. Accessed on January 30, 2026


