Ethereum Price Outlook for February 2026: Will ETH Soar or Plunge?

Jakarta, Pintu News – The Ethereum price entered February 2026 in a very crucial state. After experiencing a decline of almost 7% throughout January, ETH closed the month performing against its historical trend.
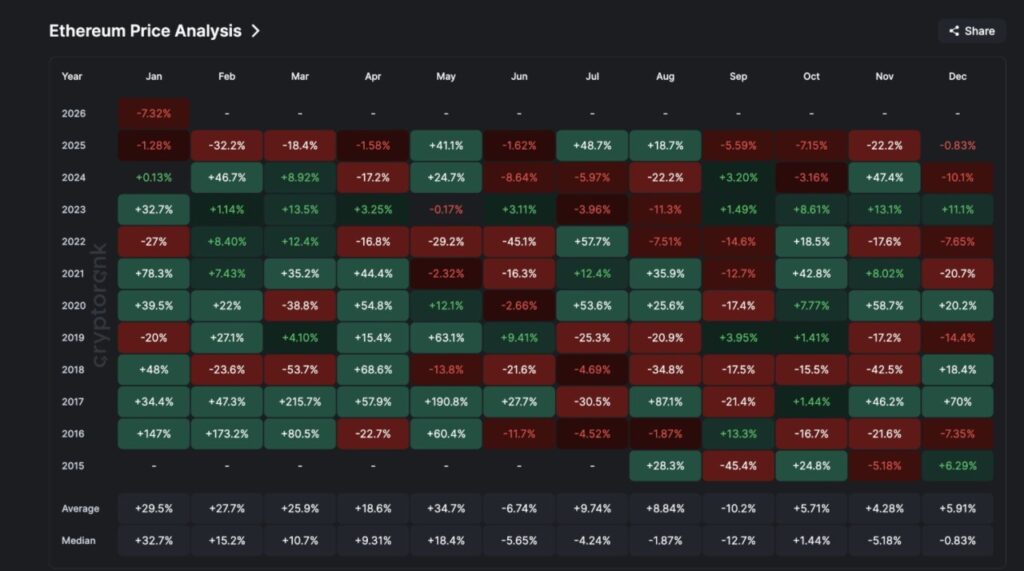
Historically, the median yield in January has been around +32%, but this year it has moved in the opposite direction. Meanwhile, February has historically recorded a median increase of around +15% since 2016.
The last time Ethereum entered February in a similar state was in 2025. Back then, market weakness continued to cause a monthly decline of 32% to 37%.
Whether 2026 will follow this pattern or deviate from it will largely depend on the interaction between technical structure, on-chain data, and institutional investment flows in the coming weeks.
Ethereum’s February History and Falling Wedge Pattern Are Important Tests
Looking at long-term data can help shape expectations. Since 2016, Ethereum has recorded a median return of around +15% in February. While not the strongest month, February has more often than not delivered gains than losses.
Read also: Ethereum Price Tumbles to $2,100 Today: Will ETH Rise or Continue to Crash?
However, January 2026 showed a different story. Instead of following the median pattern of +32% increase, ETH closed January 2026 with a decline of around 7%. This pattern is similar to 2025, where the initial weakness continued into a deeper decline in February.
Thus, Ethereum again entered February at an important junction point. However, not all analysts consider seasonal patterns a reliable guide.
The analyst team from B2BINPAY, an all-in-one crypto ecosystem for businesses, warns against relying too much on historical patterns.
“Historical patterns are not something that should be blindly relied upon. Most of these patterns exist for fairly obvious reasons,” they say.
They also added that Ethereum currently has no short-term growth triggers:
“There is no compelling reason to assume that February will definitely bring growth. Based on this, it is unreasonable to expect February to retain its historically ‘bullish’ meaning,” they explained.
As evidence, they cite last year’s incident:
“Even if we look at February 2025 as an example, Ethereum dropped by 37%,” he added.
This skepticism is also reflected in the current chart structure.
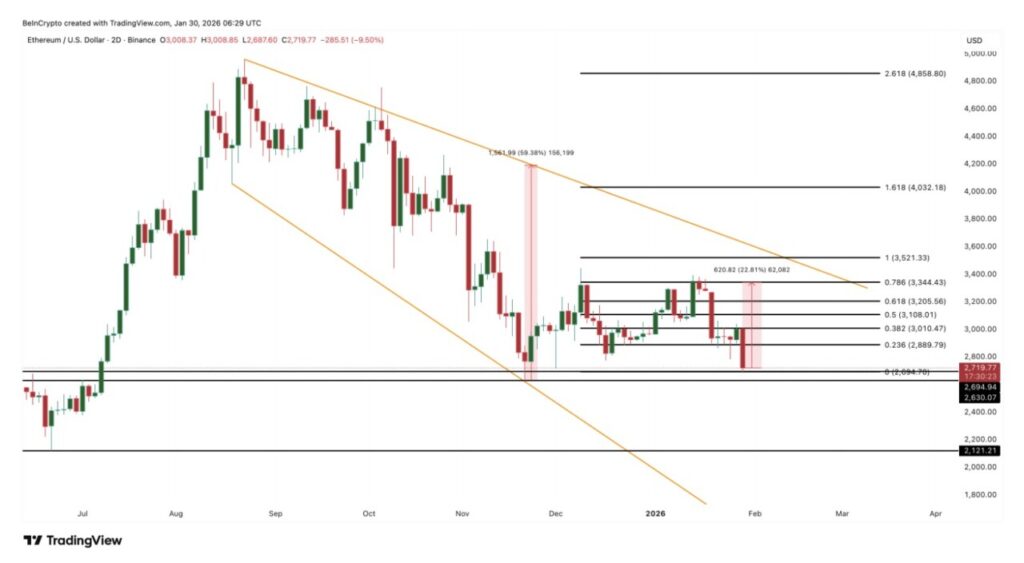
On a two-day time frame, ETH price remains within a falling wedge pattern. This pattern forms when the price prints lower and lower peaks and bottoms – often indicating weakening selling pressure and a potential reversal.
In this case, the wedge formed is quite wide and volatile. In case of a confirmed breakout, the projected upside could be around 60%. But this is a maximum target, not an exact prediction.
Momentum is also an important aspect. Between December 17 and January 29, Ethereum almost printed a new low. However, in the same period, the Relative Strength Index (RSI) indicator stayed around the 37 level. The RSI itself is used to measure the momentum dominance between buyers and sellers.
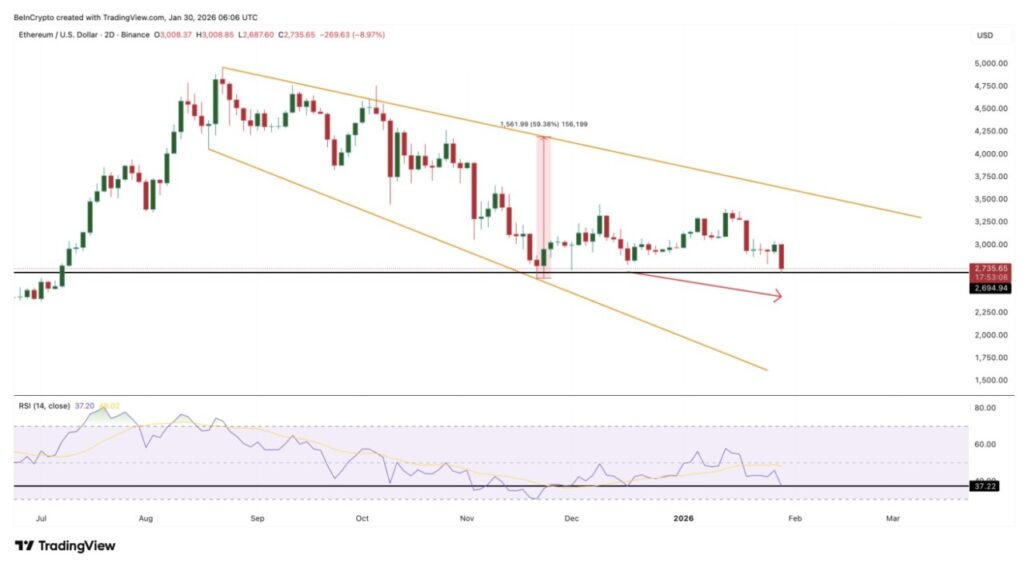
When the price drops but the RSI doesn’t, it shows that the selling pressure is starting to weaken. This situation creates the initial signal of a bullish divergence.
If Ethereum’s next price candle is able to hold above the $2,690 level and the RSI remains stable, then the chances of a reversal increase – especially if the price forms a confirmed lower low. However, as of now, there is no valid confirmation.
For this reason, on-chain data is crucial to provide a clearer picture of the next direction of movement.
On-Chain Data Supports Rebound Potential, but Confidence Starts to Weaken
On-chain data is an important tool for testing the validity of potential trend reversals. One of the key indicators is Net Unrealized Profit/Loss (NUPL), which measures investors’ profit/loss based on the current price – otherwise known as “paper profit/loss.”
Currently, Ethereum’s NUPL is around 0.19, which puts it in the “hope-fear” zone. This level is historically important. In June 2025, the NUPL fell close to 0.17 when ETH was trading at around $2,200. Within a month after that, the price jumped to around $4,800, up more than 110%.
As such, NUPL’s current position aligns with the signals from the falling wedge pattern and RSI – indicating that the selling pressure is easing, and unrealized profits are getting smaller. This creates room for an upward movement.
However, this signal is not complete. A market bottom usually occurs when the NUPL goes into the negative zone. For example, in April 2025, the NUPL dropped to -0.22, signaling total capitulation in the market.
Read also: Jupiter Global makes stablecoins that can be used for QR payments, fiat transfers, and card swipes
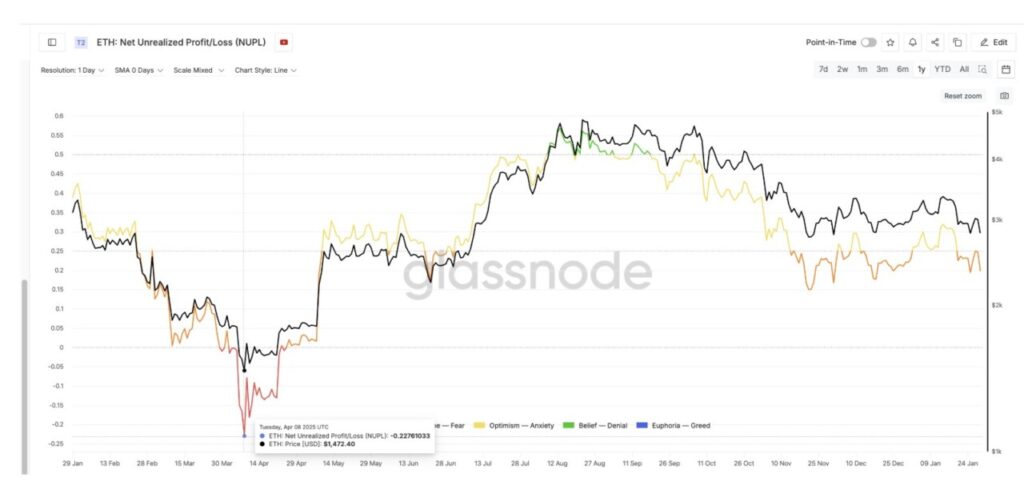
Since the current NUPL value is still well above that point, it means there is still room for further selling pressure. This is more of a relief rally, not the start of a new bullish cycle.
HODLer behavior also shows a mixed picture. Hodler Net Position Change, an indicator that tracks whether long-term investors are accumulating or selling, showed a trend of accumulation throughout January – but with a sharp decline.
- January 18: Accumulation peaked at around 338,700 ETH
- January 29th: Dropped to around 151,600 ETH, a drop of more than 55%
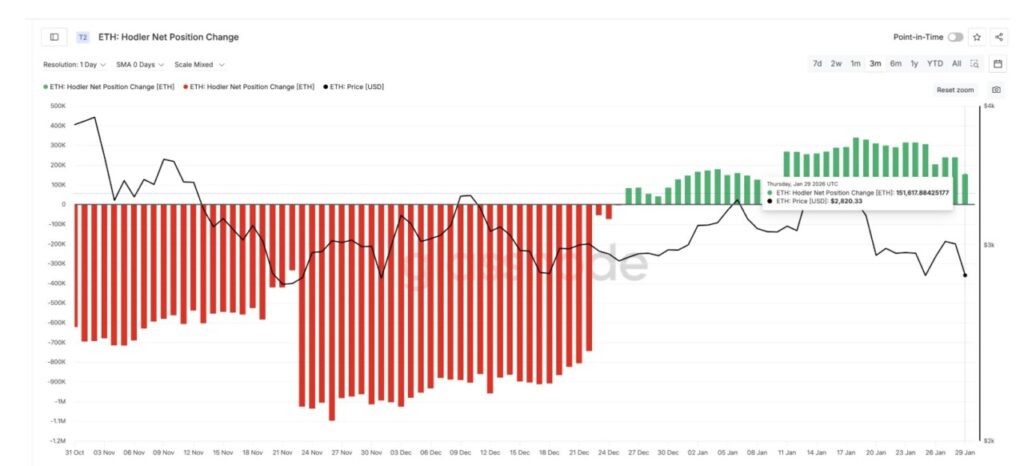
This means that although long-term investors are still buying, their confidence level has dropped significantly. This is in line with the assessment of analysts from B2BINPAY:
“Demand and supply are currently quite balanced: buyers are willing to buy at the same level as the selling price of sellers… The market needs a clear push – either up or down – to provide a firmer direction,” they said.
In conclusion, the combination of NUPL data and HODLer activity supports a potential rebound, but with fading confidence.
Crypto whales continue to accumulate, but ETFs are still not in full support
Ethereum’s big holders, or whales, are currently sending stronger signals than institutional investors. Data shows that during January, the whales continued to accumulate ETH consistently. At the beginning of the month, they held about 101.18 million ETH, and by the end of the month, that number rose to about 105.16 million ETH.
That means an increase of nearly 4 million ETH, reflecting active buying amid price weakness.
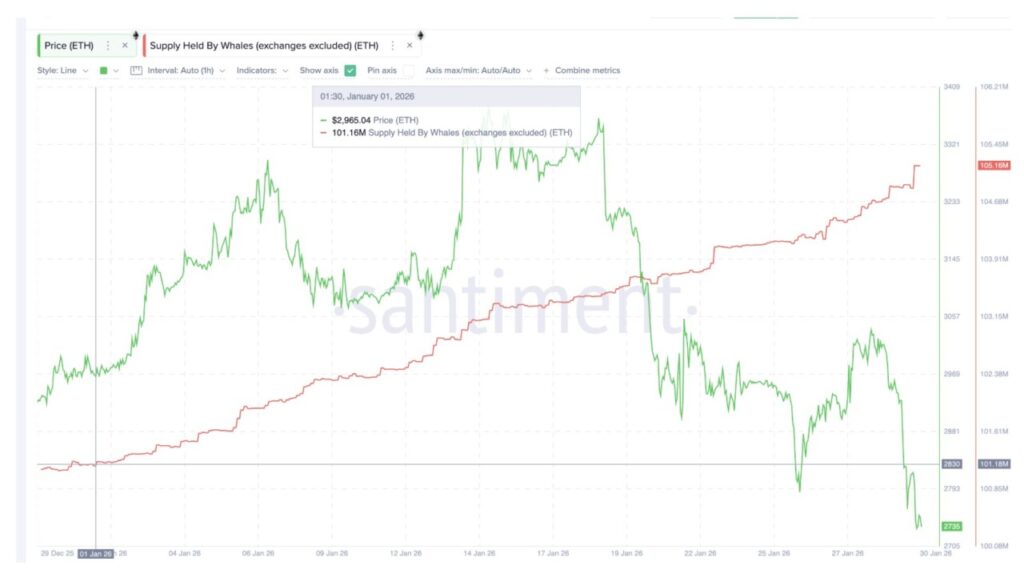
Although the price of ETH briefly declined from its peak in mid-January, large wallets continued to add exposure, which reinforced the rebound signal shown by NUPL and the falling wedge pattern.
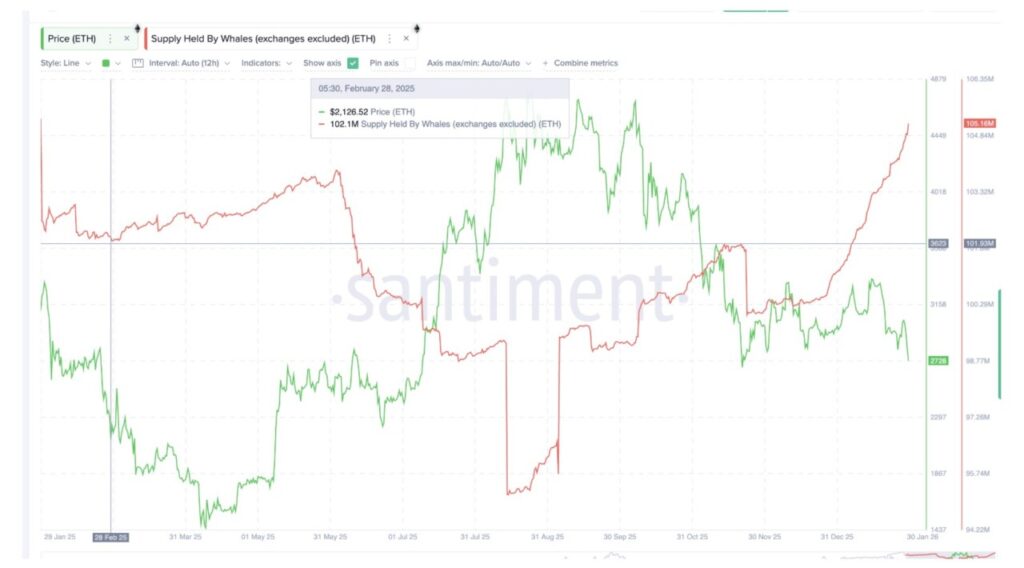
This condition is very different compared to 2025. At the end of January 2025, whale holdings stood at around 105.22 million ETH. But by the end of February, that number had dropped to around 101.96 million ETH – a massive distribution that coincided with a 32% drop in the ETH price that month. Last year, whales were selling. This year, they’re buying.
However, fund flows from ETFs (Exchange-Traded Funds) showed a more cautious attitude. Although there were a few days with large inflows, the end of January was accompanied by large outflows, with withdrawals of more than 70,000 ETH equivalents. This means that ETFs have not really supported the rebound scenario.
Read also: Will Bitcoin Collapse in 2026? Market Volatility is a Real Threat
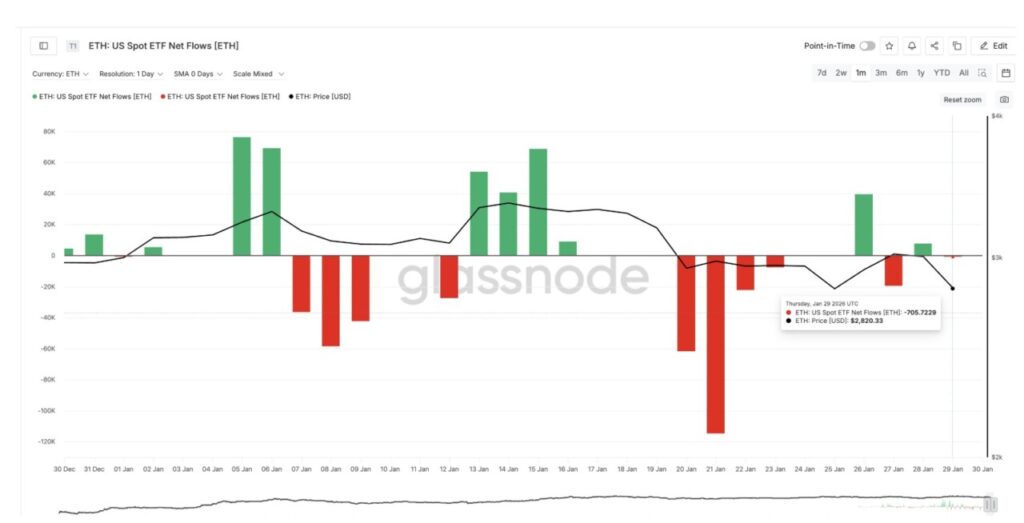
According to John Murillo, Chief Business Officer of B2BROKER, the dynamics of these ETFs reflect more of a tactical adjustment strategy, not a massive withdrawal:
“The outflows from spot-ETH ETFs in mid-January looked more like a tactical adjustment than a complete exit from the market. The reversal at the end of the month, led by large inflows into Fidelity’s FETH, suggests that institutional behavior is increasingly bifurcated,” he explained.
He added:
“ETF dynamics in January showed signs of maturation, not a complete decline in interest.”
However, Murillo also warns that if this pattern continues, derivatives could overtake the main price determinants – risking price stability:
“If February is characterized by inconsistent ETF flows, while derivatives activity continues to increase, then the dominance of price formation could shift from spot demand to leverage-driven momentum,” he said.
Ethereum Price Levels that Will Define February 2026
The previous NUPL shows that this is not a confirmed bottom. Downside risks remain. The first important support level for ETH is around $2,690.
This is in line with the last two days’ support and the previous consolidation area. A clear close below $2,690 would be a signal that sellers are back in control of the market, which opens up downside risks towards $2,120.
On the upside, Ethereum must first reclaim the $3,000 level. This is a psychological and structural barrier. The price has repeatedly failed to break this level since December.
Holding positions above $3,000 would be a signal that market confidence is starting to return.
The next resistance is around $3,340. This level has capped the rally since December 9. A breakout above this level would mark a significant change in ETH’s price structure.
Above that, $3,520 becomes the next important level. A breakout and consolidation above $3,520 will confirm momentum recovery and open up an upside opportunity towards $4,030.
Follow us on Google News to stay up to date with the latest in crypto and blockchain technology. Check Bitcoin price, usdt to idr and tokenized nvidia stock price via Pintu Market.
Enjoy an easy and secure crypto trading experience by downloading the Pintu crypto app via Play Store or App Store now. Also, experience web trading with advanced trading tools such as pro charting, various types of order types, and portfolio tracker only at Pintu Pro.
*Disclaimer
This content aims to enrich readers’ information. Pintu collects this information from various relevant sources and is not influenced by outside parties. Note that an asset’s past performance does not determine its projected future performance. Crypto trading activities are subject to high risk and volatility, always do your own research and use cold hard cash before investing. All activities of buying and selling Bitcoin and other crypto asset investments are the responsibility of the reader.
Reference:
- BeInCrypto. Ethereum Price Prediction February 2026. Accessed on February 2, 2026