XAU/USD Analysis and Predictions Today February 5, 2026

Jakarta, Pintu News – Today’s XAU/USD (gold versus US dollar) analysis reflects the dynamic nature of commodity markets as global risk sentiment, macro data, and monetary policy expectations. Gold prices remain firmly above psychologically important levels around USD 5,000 per troy ounce, although some technical pressures suggest a short-term correction could be on the cards. Here are the latest analysis and predictions based on market data and key indicators.
Gold Still Holding Above the $5,000 Level
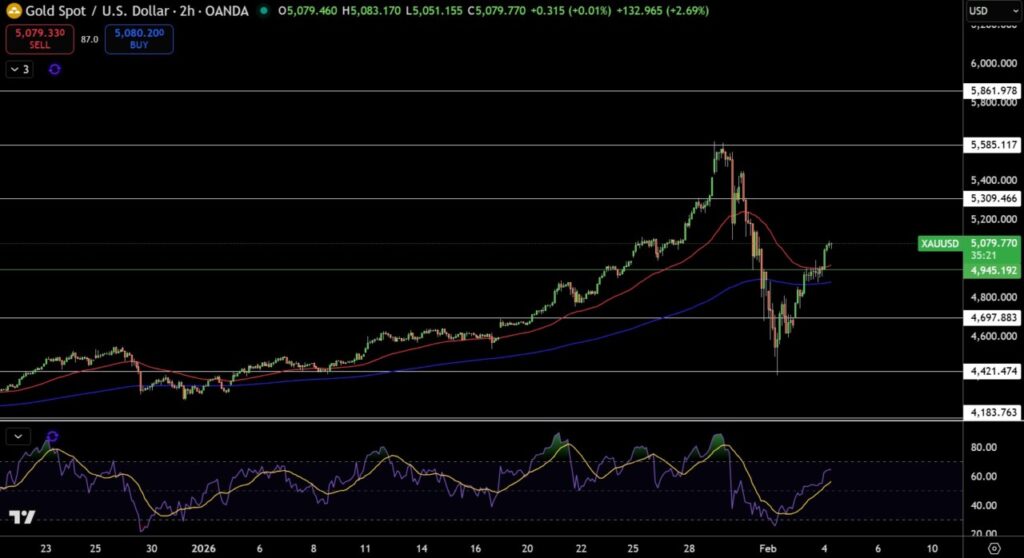
Gold (XAU/USD) is still trading above the USD 5,000 per ounce level, indicating that interest in safe-haven assets remains strong especially amid geopolitical tensions and expectations of interest rate easing by the Federal Reserve. Safe-haven demand pushed gold prices up and maintained a bullish structure despite the market’s high volatility. This suggests that XAU/USD still has a positive directional bias in the short and medium term.
The $5,000 level is an important psychological area that has been tested many times in recent sessions; prices holding above this level suggests that buyers still dominate at this support point. If XAU/USD closes the session above this area, it is likely to move higher to the next resistance target around $5,100-$5,200.
Also Read: 7 Shocking Bitcoin & Crypto Facts in Epstein Files: Crypto’s Early Traces Revealed!
Bullish Momentum Supported by Fundamental Data
Gold demand continues to be supported by expectations of monetary policy easing, as markets still anticipate future interest rate cuts by the Fed. This outlook tends to weaken the US dollar and strengthen gold prices, as XAU/USD moves in the opposite direction to dollar strength. The rapid recovery in gold prices has also been triggered by geopolitical factors that have caused investors to seek hedge assets.
Moreover, central bank activity in the gold market and gold purchases by institutions provide fundamental support in the medium term. Physical gold purchases by central banks continue to strengthen demand for the commodity as a portfolio diversification asset.
Technical Correction Risk Amid Volatility
Although gold prices remain fundamentally strong, technical analysis shows that the recent sharp rebound has pushed XAU/USD close to or even past some important resistance. This increases the chances of a technical correction in the short term if the bullish momentum weakens or if the US dollar strengthens again due to stronger-than-expected economic data.
The major resistance level is in the range of around USD 5,100-$5,200; if the price fails to break this zone consistently, XAU/USD could decline back to the support around USD 4 900-$4 950. The recent bearish candlestick pattern and momentum indicators such as MACD and RSI showing a relative decline reinforce the possibility of such a temporary correction.
Medium-Term Outlook: Bullish Potential Remains Open
In the medium to long term, the technical structure of XAU/USD still maintains a bullish bias. Many analysts project that gold could reach a new price record if safe-haven demand remains high and expectations of interest rate cuts materialize. Gold price projections in the global market even touch targets above USD 5,400 to USD 6,000 per ounce towards the end of 2026, with the support of demand by institutional investors and central banks.
However, factors such as an unexpected global economic recovery or strong US economic data could depress gold prices by strengthening the dollar and reducing gold’s appeal as a zero-yield asset. Thus, the direction of XAU/USD in the next few weeks will largely depend on macroeconomic data, monetary policy, as well as the level of geopolitical tensions.
Conclusion of Today’s XAU/USD Prediction
Gold (XAU/USD) still maintains a strong position above the USD 5,000 psychological level, supported by increased safe-haven demand and interest rate easing expectations. Technical analysis suggests a bullish bias in the medium term, but the presence of resistance pressure around USD 5,100-$5,200 as well as technical correction signals raise the possibility of a temporary downside push. Investors need to monitor key support levels around USD 4,900-$4,950 and gains above USD 5,100 as a sign of trend strengthening.
Also Read: 4 Shocking Facts about Bitcoin Breaking Rp1.42 Billion: Similar to BTC April 2025 Technical Signal!
Follow us on Google News to stay up to date with the latest crypto and blockchain technology. Check Bitcoin price, USDT to IDR and Nvidia stock price tokenized via Pintu Market.
Enjoy an easy and secure crypto trading experience by downloading the Pintu crypto app via Play Store or App Store now. Also, experience web trading with advanced trading tools such as pro charting, various order types, and portfolio tracker only at Pintu Pro.
*Disclaimer
This content aims to enrich readers’ information. Pintu collects this information from various relevant sources and is not influenced by outside parties. Note that an asset’s past performance does not determine its projected future performance. Crypto trading activities are subject to high risk and volatility, always do your own research and use cold hard cash before investing. All activities of buying and selling Bitcoin and other crypto asset investments are the responsibility of the reader.
Reference:
- FXEmpire. Gold (XAUUSD) & Silver Price Forecast: Gold Holds $5,000 as Silver Eyes $94 – Breakout or Pause? Accessed February 5, 2026.


