Bitcoin Hits $66,000: A Look at Historical Trends to Predict the Next Breakout
Jakarta, Pintu News – Bitcoin’s recovery amid a period of extreme market fear could carry significant meaning for investors who are still hesitant to reallocate their capital.
However, until the last week of February, Bitcoin’s price action has not shown any clear positive signals. Some historical data also gives an idea of how long this negative sentiment is likely to remain in the market.
Then, how will the Bitcoin price move today?
Bitcoin Price Rises 2.67% in 24 Hours
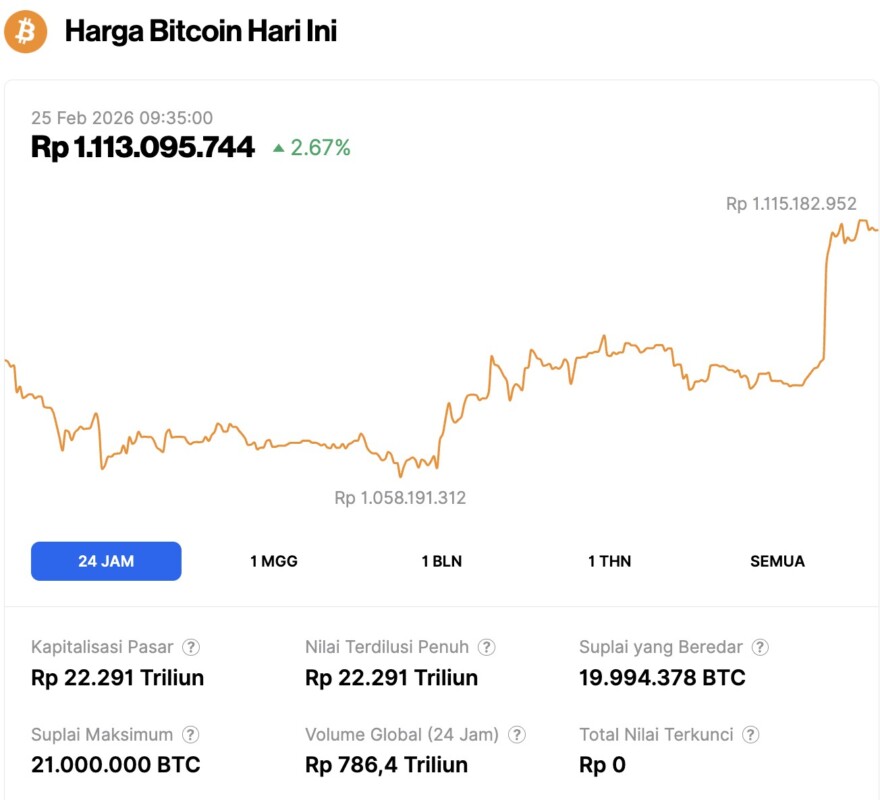
Bitcoin showed steady momentum on February 25, 2026, climbing 2.67% over the last 24 hours to reach $66,124—roughly IDR 1,113,095,744. It was a day of notable recovery; after dipping to a low of IDR 1,058,191,312, the cryptocurrency rallied to hit a daily peak of IDR 1,115,182,952.
While Bitcoin’s market capitalization remains robust at approximately IDR 22,291 trillion, trading activity has cooled slightly, with 24-hour volume dipping 6% to IDR 786.4 trillion.
Read also: The Impact of Trump’s 10% Global Tariff on Bitcoin and Crypto Market: What to Know?
Next 6 Months Could Test Investor Patience
According to Glassnode, the Realized Profit/Loss Ratio (SMA-90) provides important signals to assess current market conditions.
Realized Profit represents the total USD value of all coins moved on-chain at a price higher than their acquisition cost. Conversely,Realized Loss represents the total USD value of all coins moved at a price lower than their acquisition cost.
Glassnode applies a90-day moving average to dampen daily volatility. This method helps identify the dominant market trend that occurred over the past three months.
- Ratio above 1.0: Profits dominate the market. Conditions are in a net profit state, where investors tend to sell assets to secure profits(lock in gains).
- Ratio below 1.0: Losses dominate the market. Most market participants who move coins realize losses, which are often triggered by capitulation. This condition usually arises during bearish market phases.
Current data shows that the ratio dipped below 1 in February, for the first time since 2022. Historically, this period below the 1 level usually lasts for about six months.
“The Realized Profit/Loss Ratio (SMA-90) has now dropped below 1, confirming a full transition to an excess loss realization regime. Historically, breakouts below the 1 level have persisted for over 6 months before being recaptured-a recovery that usually signals a constructive return of liquidity to the market,” reports Glassnode.
The bear market cycles in 2015, 2018, and 2022 all followed this six-month pattern. The historical data suggests that Bitcoin may enter a prolonged downward trend or remain stagnant at low levels until the end of Q3 this year.
Or Maybe Just One More Month
Monthly performance data offers a different perspective for market participants.
February could be the fifth consecutive negative month for Bitcoin. Historically, the longestlosing streak lasts for 6 months before the market finally reverses sharply.
Read also: 3 Major Token Unlocks Worth Watching This Week, Potentially Up or Down?
“There are no guarantees in the market. However, periods of extreme fear often appear near major turning points. History shows that those who buy during the ‘red’ months often reap the most benefits when the market begins to recover,” said investor Gayu_BTC.
This reasoning suggests that Bitcoin could potentially recover as soon as April. That timeline would arrive much earlier than the projections implied by Glassnode’s previous analysis.
History may not repeat itself exactly, but at least it provides a logical reference. If the analysis is based solely on the magnitude of the decline, the statistics from the “Priced in ₿itcoin” account suggest a profitable opportunity for investors who can afford to buy at low prices.
“Bitcoin has dropped 47% from its all-time high(ATH). Historically, buying at -50%drawdown has awin rate of 90% over a 1-year period, with a median return of +95%. At a -70% drawdown, the win rate is 100%-never losing. Even the worst outcome still recorded a +25% gain,” the account said.
Meanwhile, the latest analysis from the BeInCrypto website emphasizes the importance of the $60,000 level. Analysts view this price as a critical limit that will determine the direction of Bitcoin’s trend in the coming months.
Follow us on Google News to stay up to date with the latest in crypto and blockchain technology. Check Bitcoin price, usdt to idr and tokenized nvidia stock price through Pintu Market.
Enjoy an easy and secure crypto trading and crypto gold investment experience by downloading the Pintu crypto app via Play Store or App Store now. Also, experience web trading with advanced trading tools such as pro charting, various order types, and portfolio tracker only at Pintu Pro.
*Disclaimer
This content aims to enrich readers’ information. Pintu collects this information from various relevant sources and is not influenced by outside parties. Note that an asset’s past performance does not determine its projected future performance. Crypto trading activities are subject to high risk and volatility, always do your own research and use cold hard cash before investing. All activities of buying and selling Bitcoin and other crypto asset investments are the responsibility of the reader.
Reference:
- BeInCrypto. How Long Until Bitcoin Recovers? Accessed on February 25, 2026