Dogecoin Price Shows Positive Trend Today: Is DOGE Ready to Soar?

Jakarta, Pintu News – Dogecoin price action continues to reflect fragility on the four-hour chart (24/2), assellers defend key resistance levels and derivatives data signals limited market risk appetite.
The meme-based cryptocurrency briefly traded around $0.091 and is still struggling to establish sustained upward momentum. Despite a short-termrebound, broader technical indicators remain supportive of a bearish market structure.
So, how is the Dogecoin price moving today?
Dogecoin Price Rises 1.10% in 24 Hours
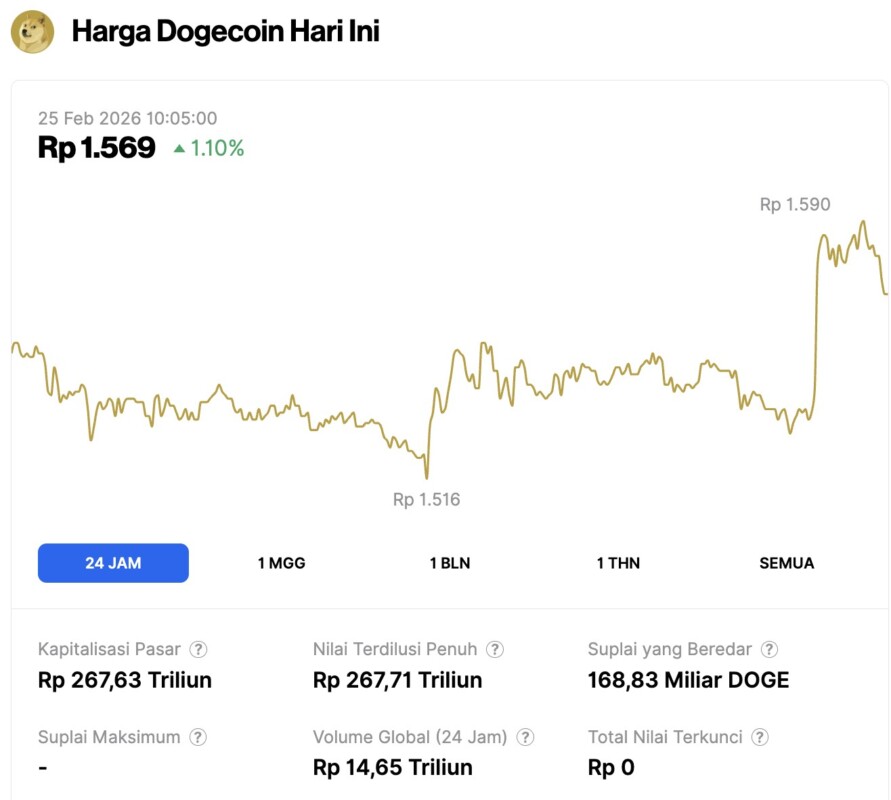
On February 25, 2026, Dogecoin saw a modest gain of 1.10% over the last 24 hours, bringing its price to $0.09345, or approximately IDR 1,569. The popular meme coin experienced some steady movement throughout the day, trading between a low of IDR 1,516 and a high of IDR 1,590.
As it stands, Dogecoin maintains a significant market capitalization of around IDR 267.63 trillion, even as daily trading volume settled at IDR 14.65 trillion.
Read also: Ethereum Reclaims $1,900 as the Foundation Commits 70,000 ETH to Network Staking
Technical Structure Shows Pressure in the Upper Area
DOGE/USD remains stuck below thecluster of the 20, 50, 100 and 200 EMAs on the four-hour time frame. This alignment confirms continued short-term weakness. Moreover, the price recently attempted a recovery but stalled before managing to reclaim the key Fibonacci resistance.
The Fibonacci range highlights $0.0982 level at 0.236 Fibonacci as the closest resistance. Above that level, $0.1093 at 0.382 retracement stands as a stronger barrier. The last rally attempt was observed to fade just below $0.1093, which reinforced the magnitude of selling pressure(supply) in the upper area.
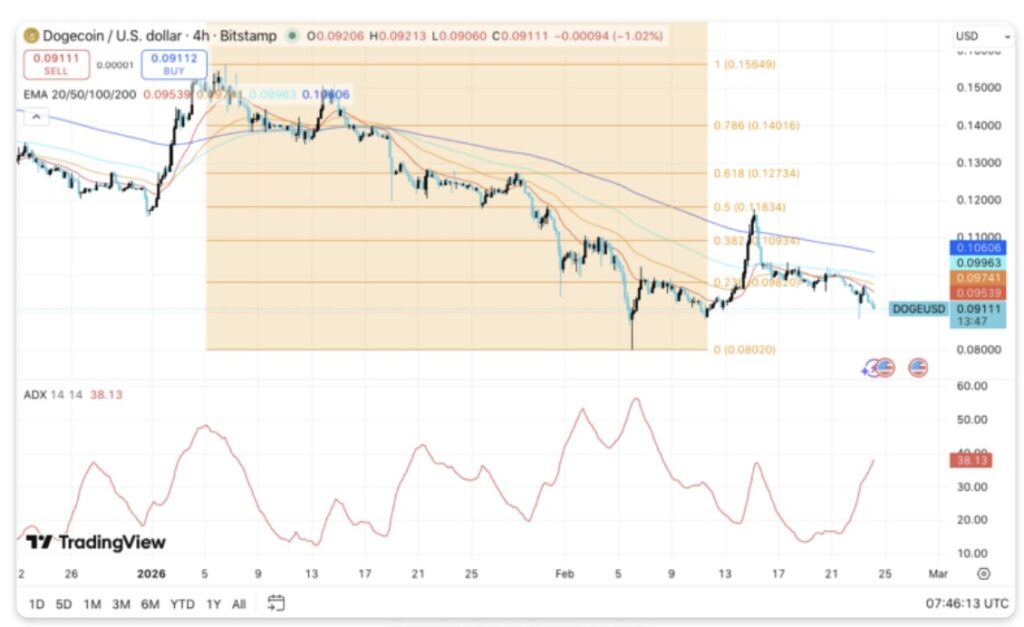
If the buyers manage to reclaim $0.1093, the momentum could extend towards $0.1183 at 0.5 level. Additionally, $0.1273 level at 0.618 retracement marks the next bullish target. However, the bulls will have to first overcome the $0.0982 zone to change the short-term sentiment.
On the downside,support lies between $0.0900 and $0.0910. A decisive break below this area would open the way towards $0.0802, which is critical structural support. Failure to hold the $0.0802 level will confirm a continuation of the broader downtrend.
Significantly, the ADX indicator shows a reading near 38, which signals a strengthening of the trend’s momentum. As the price is trading below the major moving average line, sellers are currently still in control of the market.
Open Interest Reflects Controlled Leverage
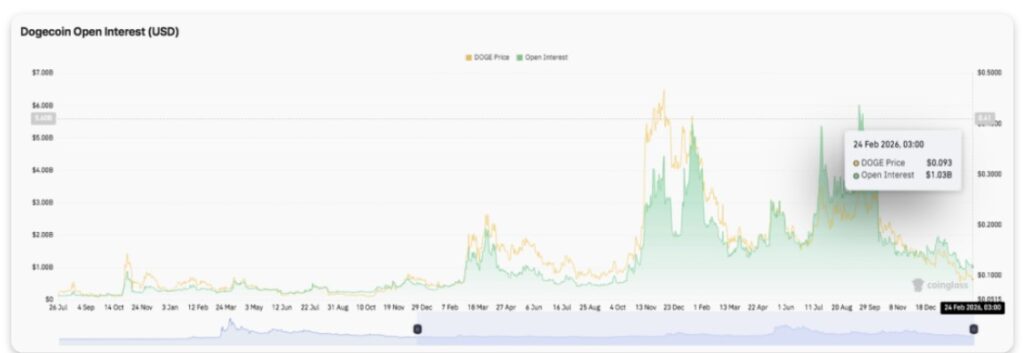
Derivative positioning provides additional context for the market. Early in the cycle, open interest remained below $1 billion, indicating limited speculative activity. As a result, leverage increased aggressively during the main rally, pushing the open interest figure beyond $5 billion.
Read also: PEPE Coin Ready to Explode? Analysts Predict 758% Surge Amid Bearish Pressure!
As price momentum faded, open interest declined sharply. The contraction confirms the liquidation of long positions as well as a reduction in risk exposure. The latest data suggests another phase of expansion, albeit much weaker in strength than previous peaks.
As of February 24, 2026, open interest stood at $1.03 billion. This level indicates moderate market participation, rather than euphoric speculation. Additionally, the restrained leverage profile signals that traders are approaching the current price level with caution.
Exchange Flows Signal Continued Distribution
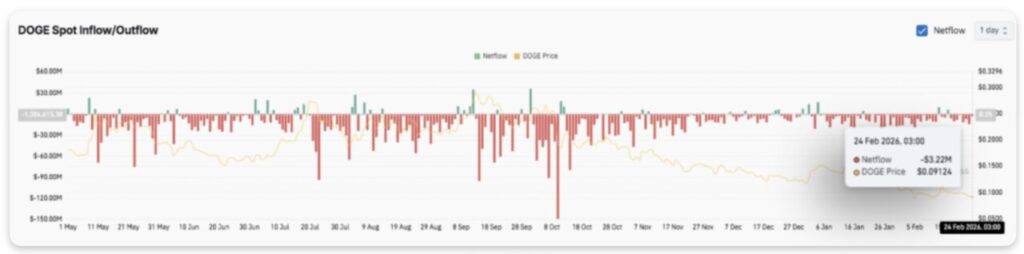
Spot flow data reinforced the cautious tone. Red netflow bars dominated most of the session, reflecting steady deposits to the exchanges. In addition, some spikes inoutflows had appeared during the volatile period in late September and early October.
However, the recentinflow efforts were observed to be short-lived and limited. Netflow currently stands at negative $3.22 million. Hence, sellers are seen continuing to transfer tokens to exchanges while DOGE is trading at around $0.091.
Dogecoin Price Technical Projections
Key levels remain clearly defined for Dogecoin as the price trades around $0.091 on the 4-hour chart (Feb 24). The broader market structure remains bearish, with DOGE stuck below its 20, 50, 100, and 200 EMAs. However, the compression near localsupport suggests that a decisive move may be imminent.
- Upside Levels: The immediate resistance is at $0.0982, followed by $0.1093. A confirmedbreakout above $0.1093 could open the way towards $0.1183 and $0.1273. Reclaiming the $0.1093 level would also bring the price back above the major Fibonacci resistance while turning the short-term momentum more positive.
- Downside: Initial support is in the $0.0900-$0.0910 area. A break below this zone will expose the $0.0802 level, which remains a critical structural floor. Missing the $0.0802 level will invalidate the corrective recovery scenario and confirm the continuation of the downward trend on a broader scale.
- Upper Resistance Limit: Thecluster of EMAs above the current price acts as a dynamic barrier. The buyers(bulls) should be able to reverse this region (into support) to regain control of the market in the medium term.
The technical picture shows that DOGE is consolidating inside a broader bearish channel, while the ADX indicator near 38 is signaling stronger trending conditions. Thissetup suggests that volatility expansion could follow once support or resistance levels are convincingly broken.
Follow us on Google News to stay up to date with the latest in crypto and blockchain technology. Check Bitcoin price, usdt to idr and tokenized nvidia stock price via Pintu Market.
Enjoy an easy and secure crypto trading and crypto gold investment experience by downloading the Pintu crypto app via Play Store or App Store now. Also, experience web trading with advanced trading tools such as pro charting, various order types, and portfolio tracker only at Pintu Pro.
*Disclaimer
This content aims to enrich readers’ information. Pintu collects this information from various relevant sources and is not influenced by outside parties. Note that an asset’s past performance does not determine its projected future performance. Crypto trading activities are subject to high risk and volatility, always do your own research and use cold hard cash before investing. All activities of buying and selling Bitcoin and other crypto asset investments are the responsibility of the reader.
Reference:
- CoinEdition. Dogecoin (DOGE) Price Prediction: Can Bulls Reclaim $0.098? Accessed on February 25, 2026