Bitcoin Climbs Back to $67,000 as BTC ETF Inflows Hit $506 Million

Jakarta, Pintu News – Bitcoin price briefly traded around $68,438, up 0.88% on February 26, 2026, as the asset continued its sharp recovery from February’s low of $60,133.
The rise comes after the spot Bitcoin ETF recorded net inflows of $506.51 million on February 25, while a lawsuit against Jane Street sparked relief sentiment across various crypto markets. So, how will Bitcoin price move today?
Bitcoin Price Drops 0.76% in 24 Hours
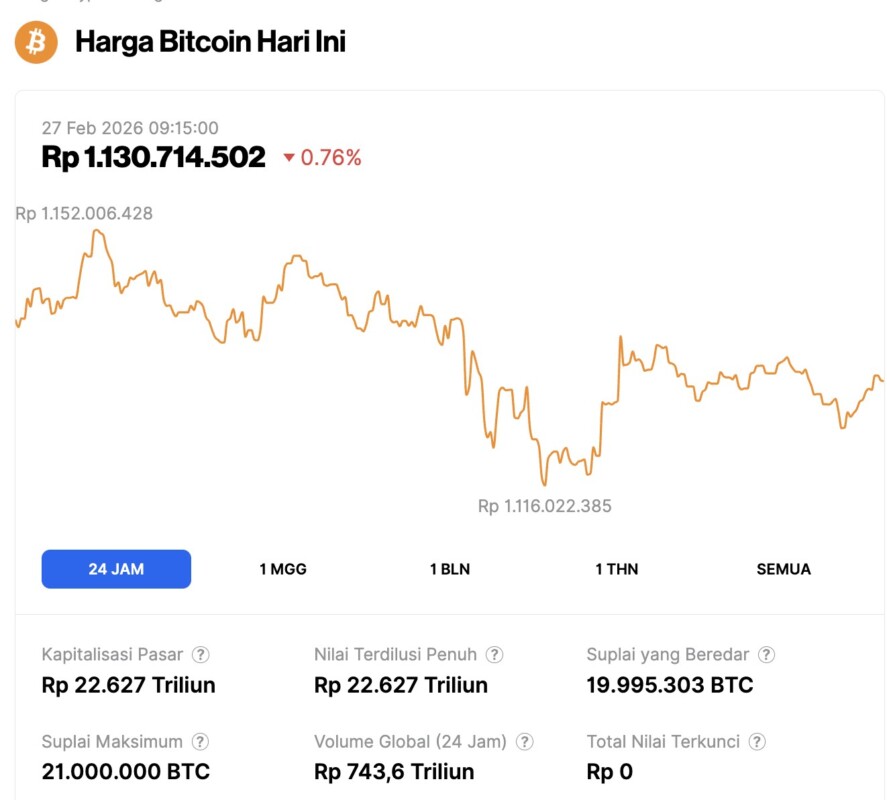
On February 27, 2026, Bitcoin traded at $67,390 (around IDR 1,130,714,502), slipping 0.76% over the past 24 hours. Within that window, BTC moved between a low of IDR 1,116,022,385 and a high of IDR 1,152,006,428.
At the time of writing, Bitcoin’s market capitalization is approximately IDR 22,627 trillion, while 24-hour trading volume fell 19% to IDR 743.6 trillion.
Read also: 3 Rarely Highlighted Bullish Bitcoin Indications
Bitcoin breaks through resistance after lawsuit against Jane Street
After weeks of consistent declines and selling pressure, Bitcoin reversed course in surprisingly short order. Prices surged, many short positions were liquidated, and market sentiment changed from despair to more cautious optimism.
Some traders on crypto social media believe that the trigger for this change was neither a macroeconomic event nor an ETF announcement, but a lawsuit that brought Jane Street into the spotlight.
The legal action stems from a lawsuit filed by the administrator handling the Terraform Labs closure process. The lawsuit alleges insider trading and market manipulation related to the company’s collapse in 2022. In the document, Jane Street is named as a counterparty to the transaction that allegedly benefited from inside information.
Jane Street denied the allegations and called the lawsuit an attempt to shift responsibility for Terraform’s downfall.
BTC ETFs record $506.51 million inflows as institutional interest returns
Based on SoSoValue data, the spot Bitcoin ETF posted daily net inflows of $506.51 million on February 25, becoming one of the days with the strongest institutional buying in recent weeks.
BlackRock’s IBIT product led the way with $61.56 million, while Fidelity’s FBTC recorded $30.09 million. Total net assets reached $87.60 billion, equivalent to 6.34% of Bitcoin’s market capitalization. These inflows represent a sharp reversal compared to the outflows that lasted throughout most of February.
When institutional funds return on this scale after a period of consecutive selling, it is often read as an indication that the worst of the distribution phase is beginning to subside.
Open Interest Rises 3.81% as Volume Surges
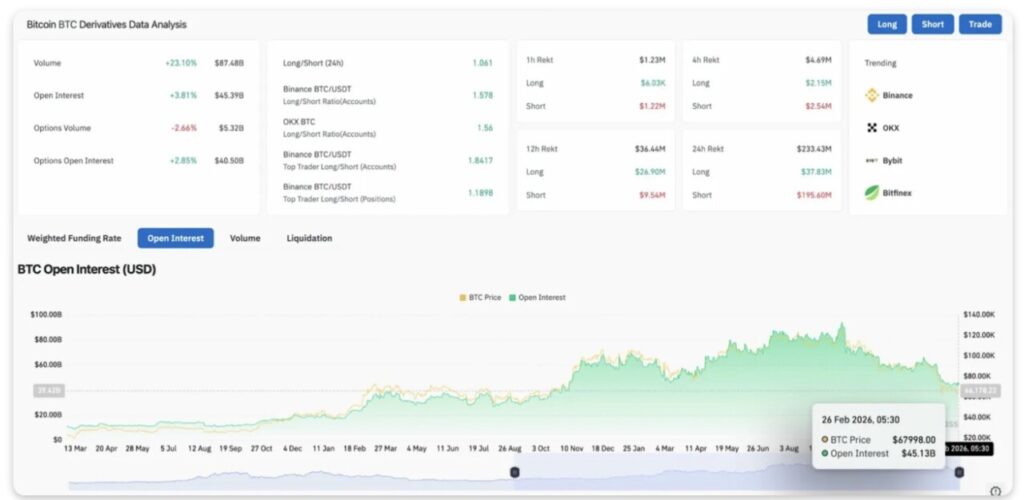
Referring to Coinglass, Bitcoin’s open interest increased 3.81% to $45.39 billion, while volume rose 23.10% to $87.48 billion. The long/short ratio shows a more dominant bullish position, 1.58 on Binance and 1.56 on OKX, respectively.
Read also: Solana (SOL) Ready to Break $100 if Bitcoin Rises to $72,000 Again? Check out the Analysis!
Top traders’ positioning data showed around $26.90 million in long positions versus $9.54 million in short positions in the 12-hour framework, indicating large accounts are likely to install a continued bull scenario. The 24-hour liquidation data also recorded $37.83 million in long liquidations versus $195.60 million in short liquidations, confirming this rally was triggered by a significant short squeeze.
When short liquidation far outpaces long liquidation, the market can enter a self-reinforcing feedback loop: the forced covering action pushes the price up, triggers the next stop, and magnifies further buying pressure.
Price Tests 0.5 Fibonacci Resistance at $69,873
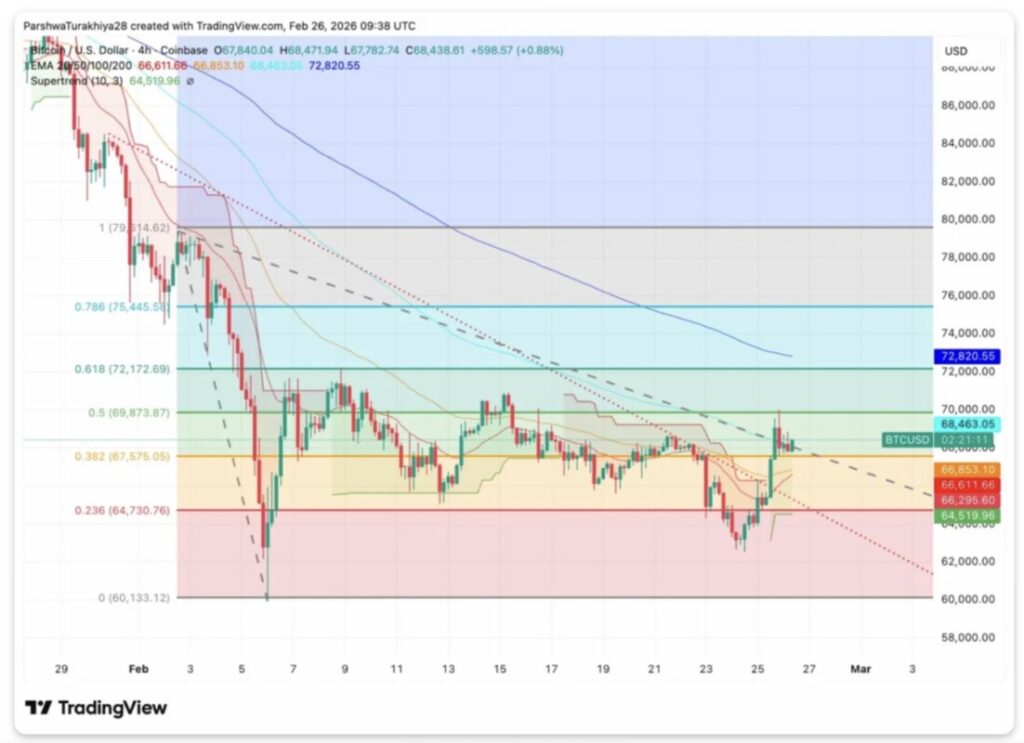
The 4-hour chart (Feb 26) shows that Bitcoin is testing the 0.5 Fibonacci retracement level at $69,873 after successfully breaking the 0.382 level at $67,575. The 20-period EMA is at $66,611, 50-period EMA at $66,853, 100-period EMA at $68,463, and 200-period EMA at $72,820. The Supertrend indicator turned bullish at $64,519.
Key points on the chart:
- Price tests 0.5 Fibonacci resistance at $69,873
- Supertrend turns bullish at $64,519 for the first time in weeks
- Fibonacci 0.618 at $72,172 is the next resistance
- Neat breakout above 0.382 level confirms momentum shift
Previously, Bitcoin fell from the area above $126,000 in October to $60,133 in February, which equates to a correction of about 52%. The current rally towards $68,438 means a recovery of about 14% from that low in just 48 hours. Fibonacci levels provide relatively clear resistance zones ahead: $69,873 (0.5), $72,172 (0.618), and $75,445 (0.786).
A 4-hour candle close above $69,873 would confirm a breakout of the 0.5 Fibonacci level and open the door for a move towards $72,172. The Supertrend change to bullish also indicates that this rise has the potential to be more than just a momentary recovery rally.
Follow us on Google News to stay up to date with the latest in crypto and blockchain technology. Check Bitcoin price, usdt to idr and tokenized nvidia stock price through Pintu Market.
Enjoy an easy and secure crypto trading and crypto gold investment experience by downloading the Pintu crypto app via Play Store or App Store now. Also, experience web trading with advanced trading tools such as pro charting, various order types, and portfolio tracker only at Pintu Pro.
*Disclaimer
This content aims to enrich readers’ information. Pintu collects this information from various relevant sources and is not influenced by outside parties. Note that an asset’s past performance does not determine its projected future performance. Crypto trading activities are subject to high risk and volatility, always do your own research and use cold hard cash before investing. All activities of buying and selling Bitcoin and other crypto asset investments are the responsibility of the reader.
Reference:
- Coin Edition. Bitcoin Price Prediction: Bulls Target $73K After Jane Street Shockwave. Accessed on February 27, 2026