3 Crypto RWAs Potential March 2026: Ready to Rebound from a Sharp Correction?

Jakarta, Pintu News – Real-world asset (RWA) tokens have continued their weakening trend throughout February 2026. A number of large RWA tokens worth monitoring are now more than 80% below their recent price peaks. Selling pressure is widespread and aggressive.
However, going into March, we started to see technical reversal signals forming on some charts, supported by a decrease in token inflows to exchanges and steady demand for ETFs. Here are three tokenized asset projects that are starting to show changes in their setup structure.
Stellar (XLM)
Stellar’s footprint in the real-world asset (RWA) realm continues to expand despite the token’s still depressed performance. According to RWA.xyz data, the value of distributed assets on the Stellar network increased to $1.27 billion, up about 25% in the last 30 days.
Read also: 3 Altcoins that Crypto Whales Are Quietly Hunting for Potential March 2026
On the institutional front, CME Group launched a Stellar futures contract on February 9, 2026. Standard and micro-size contracts are now live, giving institutions regulated access to XLM for the first time.
However, the price of XLM has not reflected these gains. In the last three months or so, Stellar is down about 40% and is trading at around $0.154. However, the technical structure is starting to indicate a change.
In the period from December 18 to February 24, XLM formed a lower low, while the Relative Strength Index (RSI) actually printed a higher low. This pattern is known as bullish divergence and is generally read as a reversal signal. A similar configuration also appeared around February 11; after which XLM rallied approximately 23% before correcting.
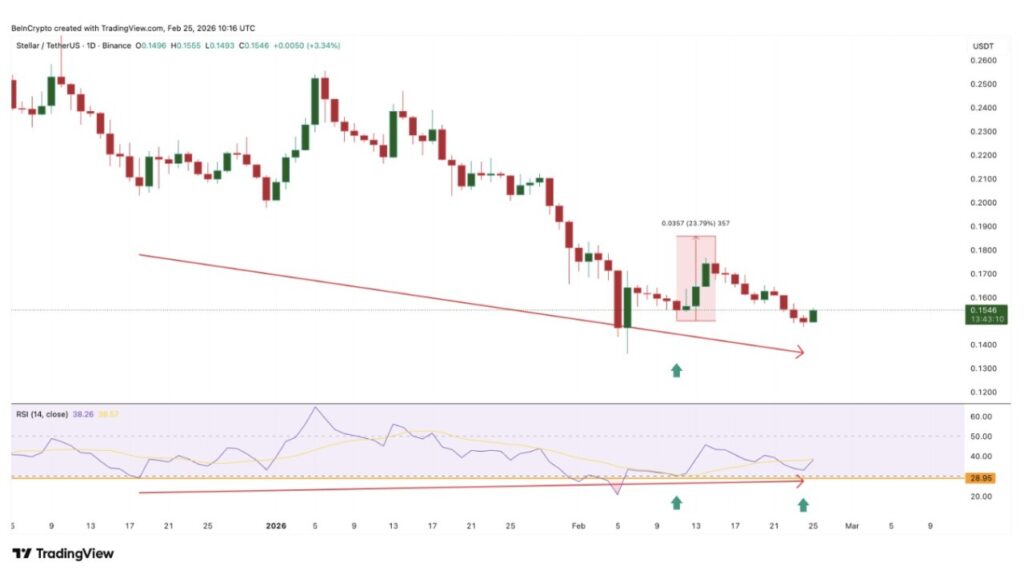
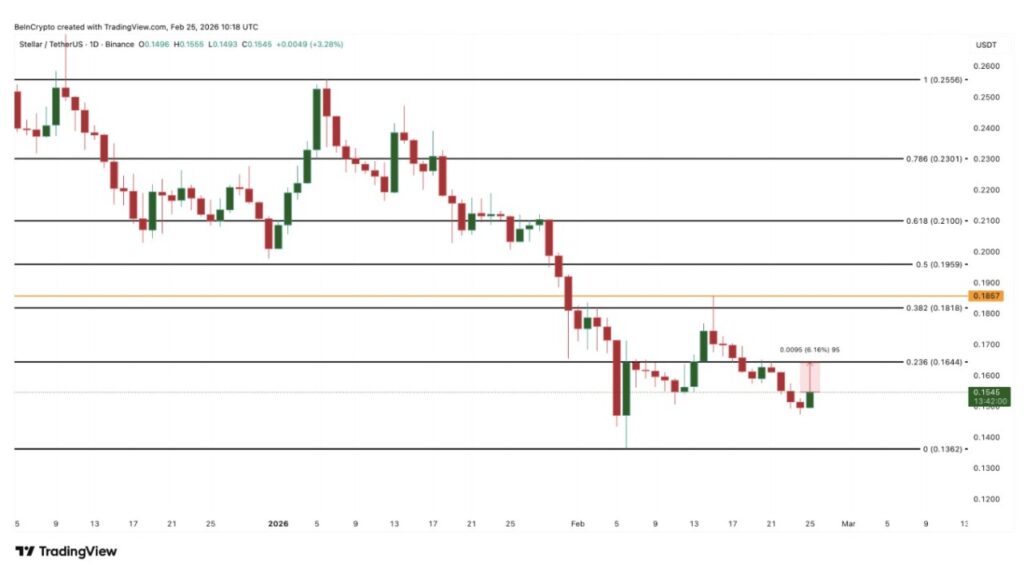
If the current divergence is realized ahead of March, the initial test level will be at $0.164, an area that has changed its role as support and resistance several times. If this level is broken, the next target would be $0.185 (the area of the last rally peak) and then $0.210, which is close to the 0.618 Fibonacci retracement and potentially the first meaningful structural change in recent months.
If it breaks further, the $0.230 area becomes the next scenario.
On the risk side, failure to retake $0.164 is likely to keep the move in a range. A drop below $0.136 will weaken, even invalidate, the reversal thesis.
With RWA adoption on the rise and institutional derivatives infrastructure already in place, Stellar (XLM) stands out as an RWA token worth monitoring in March. Fundamentals are strengthening, while divergence signals suggest price could potentially catch up.
Chainlink (LINK)
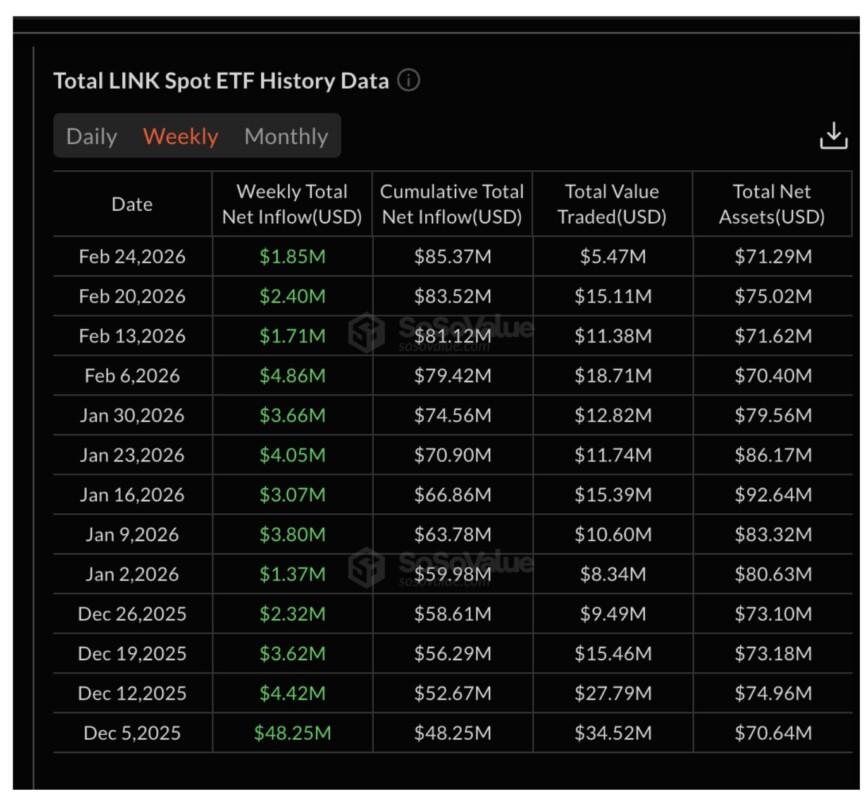
Chainlink continues to lead the way as the oracle infrastructure for the tokenized asset ecosystem, and the performance of its spot ETF further reinforces that position. While Bitcoin ETFs have experienced nearly six consecutive weeks of net outflows, Chainlink ETFs have not recorded a single “red” week since their launch.
Such consistency is relatively rare in risk-off market conditions, especially in the RWA sector, and indicates stable institutional-grade demand despite the general weakening of crypto sentiment.
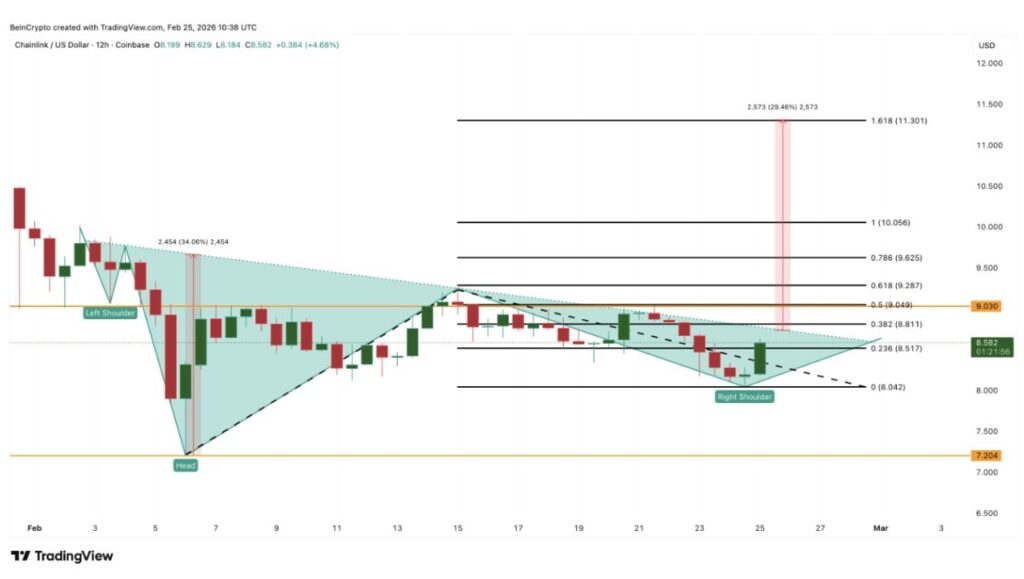
Technically, LINK’s chart on the 12-hour timeframe is starting to form an inverse head and shoulders pattern, which in theory has a breakout potential of around 35% if the neckline is broken.
However, the neckline is downward sloping, so it would take a clean break of the 12-hour candle above $9.00 to trigger a move. Chainlink tested this area on February 19-21 when it bounced off the right shoulder, but was rejected at $9.00 and experienced a pullback. The rejection makes the neckline level even more crucial. Confirmation of a daily close above it would be a strong signal, both technically and sentimentally.
If LINK is able to reclaim $9.00, the breakout path could potentially lead to $11.30, in line with the measured move projection of the pattern. However, important resistance around $10.00 could still be a deterrent to the rally.
On the risk side, losing $8.00 will weaken the structure. A decisive drop below $7.20 will invalidate the inverse head and shoulders pattern and shift the bias to bearish.
With growing on-chain adoption of tokenized securities and cross-chain interoperability, and ETF flows showing no sign of weakening, Chainlink remains a relatively strong RWA token to monitor heading into March. The failure of the previous neckline test makes the next attempt decisive.
If $9.00 is broken, this setup has the potential to produce one of the neatest moves in the real-world asset space this quarter.
Ondo Finance (ONDO)
Ondo Finance is still one of the largest tokenized asset platforms in the real-world asset sector, with a total locked value exceeding $2.5 billion. However, ONDO’s token appreciation has not kept pace with its platform expansion.
Since printing an all-time high of $2.14 in December 2024, ONDO has fallen more than 80% and is now trading around $0.25. This gap places ONDO as one of the most “discounted” looking RWA tokens when compared to the fundamental growth of its platform.
From a technical perspective, there are indications of change. From January 25 to February 24, ONDO formed a lower low, while the Relative Strength Index (RSI) printed a higher low. This combination is a bullish divergence, a commonly used early trend reversal signal, similar to the pattern discussed on XLM earlier.
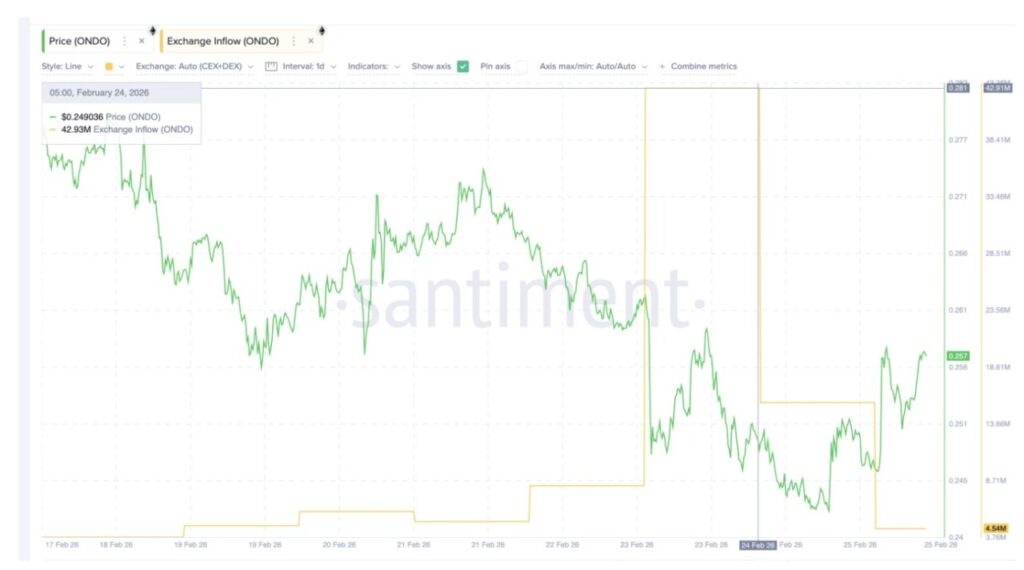
On-chain data also corroborated this signal. After February 24, token inflows to exchanges fell sharply, from 42.91 million ONDO to 4.54 million ONDO. This drop of around 89% can be read as less tokens moving to exchanges, which is often associated with less potential selling pressure.
When exchange inflows fall at the same time as the divergence is forming, a reasonable interpretation is that the selling pressure that drove the downtrend is weakening.
Looking ahead, the first key level is at $0.26. Holding and being able to break this area will strengthen short-term momentum and open up opportunities towards $0.30, which in recent weeks has repeatedly acted as resistance.
If $0.30 is successfully recaptured, the reversal structure will become more solid and the upside space could lead to $0.36. A move towards $0.30 itself equates to a potential upside of around 19% from current levels.
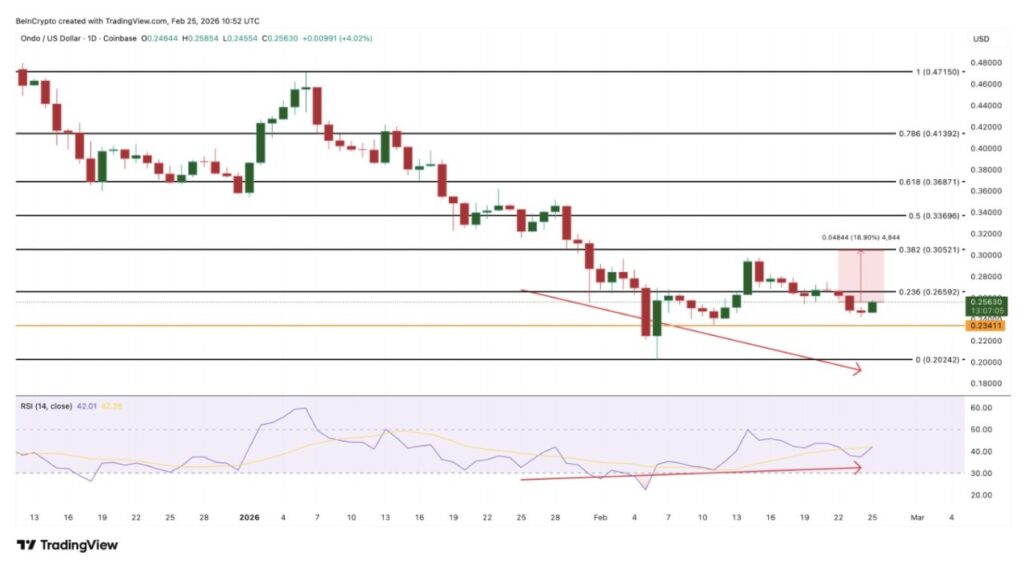
On the risk side, support is at $0.23. Missing this level increases the chances of a further decline towards $0.20, which can be viewed as the structure’s most important floor. If $0.20 is broken to the downside, the initial reversal thesis becomes weak and indicates the long-term downtrend is still dominant.
Follow us on Google News to stay up to date with the latest in crypto and blockchain technology. Check Bitcoin price, usdt to idr and tokenized nvidia stock price via Pintu Market.
Enjoy an easy and secure crypto trading and crypto gold investment experience by downloading the Pintu crypto app via Play Store or App Store now. Also, experience web trading with advanced trading tools such as pro charting, various order types, and portfolio tracker only at Pintu Pro.
*Disclaimer
This content aims to enrich readers’ information. Pintu collects this information from various relevant sources and is not influenced by outside parties. Note that an asset’s past performance does not determine its projected future performance. Crypto trading activities are subject to high risk and volatility, always do your own research and use cold hard cash before investing. All activities of buying and selling Bitcoin and other crypto asset investments are the responsibility of the reader.
Reference:
- BeInCrypto. RWA Tokens to Watch in March 2026. Accessed on February 27, 2026


