Shocking Prediction: BTC Price Could Break $500,000, Ribbon Fractal Reappears!

Jakarta, Pintu News – The crypto world has been rocked once again by a spectacular prediction from a prominent analyst who predicted that the price of Bitcoin could soar to $500,000 in the next few years. This projection is based on the reappearance of the moving average ribbon fractal pattern on the monthly chart, which has previously marked a major expansion phase in the Bitcoin (BTC) market cycle.
Putting short-term sentiment aside, this analysis highlights the strength of the technical structure as a key determinant of price direction. This prediction has also attracted the attention of market participants who are looking for strong signals for further price movements.
Ribbon Fractals: Early Signals of Bitcoin’s (BTC) Expansion Phase
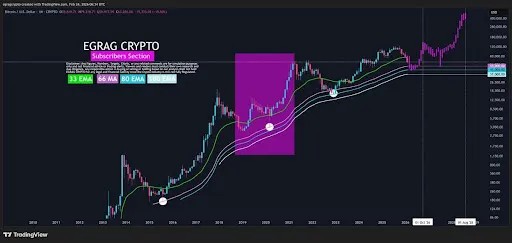
The centerpiece of the Bitcoin (BTC) price prediction towards $500,000 is the re-formation of the moving average ribbon pattern on the one-month timeframe. This pattern involves several important indicators such as the 33 EMA, 66 MA, 80 EMA, and 100 EMA that start to approach each other and then widen, signaling a potential major cycle transition. In the history of Bitcoin (BTC) price movements, similar patterns have always been followed by significant price spikes after a period of consolidation. This phenomenon is referred to as a fractal because the same pattern repeats itself across different phases of the market cycle, reinforcing the belief that a major move is imminent.
The current position of the Bitcoin (BTC) price above the moving average layer further strengthens the argument that the distribution phase has not yet occurred. In previous cycles, when the price managed to stay above this moving average cluster, a major expansion phase ensued. Based on historical data, analysts expect an intermediate target in the range of $150,000 before eventually heading towards the $500,000 peak. Thus, this ribbon pattern is the main reference in mapping the potential surge in Bitcoin (BTC) price going forward.
Also Read: 5 Easy Steps to Buy Gold at a Gold Boutique, a Safe Investment Other than Crypto!
Time Window: Predictions Toward 2026 and 2028
In addition to technical analysis, this prediction also takes into account a very specific time factor. Analysts highlight October 2026 as a pivotal point that could potentially be the start of a continuation phase if the ribbon fractal pattern develops in accordance with previous cycles. Not only that, the period from the end of the third quarter to the beginning of the fourth quarter of 2028 is also predicted to be a crucial moment, where macro factors such as the election cycle could amplify price movements. The integration of the price structure and calendar provides a clearer picture of the stages of price increases that do not occur instantly, but through a series of consolidations and accelerations.
This projection confirms that Bitcoin’s (BTC) price surge towards $500,000 is not the result of mere speculation, but is supported by a repeatable and measurable cyclical pattern. By combining technical analysis and time factors, these predictions provide a more solid framework for market participants. Each phase of consolidation and acceleration that occurred in the past becomes the main reference in projecting future price movements. This makes the predictions more credible in the eyes of the global crypto community.
Objective Analysis: Moving Averages as Cycle Determinants
The approach used in this prediction expressly excludes the often misleading fluctuations in market sentiment. The ribbon moving average is positioned as an objective indicator that reflects where Bitcoin (BTC) is in its long-term cycle. As such, any price movement that occurs above this moving average cluster is considered a strong signal that the expansion phase is continuing. This is in contrast to speculative approaches that rely solely on rumors or news.
The structure of the moving average that is currently forming is very similar to the patterns that have appeared before major price spikes in the past. Whenever Bitcoin (BTC) price manages to break and hold above the ribbon, a significant price increase phase always follows. Therefore, this pattern is considered a reliable structural roadmap for projecting future price movements. With a solid analytical foundation, the $500,000 price prediction becomes more plausible and less of an empty hope.
Bitcoin’s (BTC) Bright Future is on the Horizon
Bitcoin’s (BTC) price prediction of breaking $500,000 in the next few years is taking center stage amidst the dynamics of the global crypto market. By relying on ribbon fractal patterns and measured time analysis, this projection offers a new, more objective and structured perspective. If the cyclical pattern repeats itself, it is not impossible that Bitcoin (BTC) will set a fantastic new price record. Market participants are now looking forward to the next developments with enthusiasm and caution.
Also Read: 5 Good News on Ethereum (ETH) Legal Status, Now Officially a Digital Commodity Not a Security!
Follow us on Google News to stay up to date with the latest in crypto and blockchain technology. Check Bitcoin price, usdt to idr and tokenized nvidia stock price through Pintu Market.
Enjoy an easy and secure crypto trading and crypto gold investment experience by downloading the Pintu crypto app via Play Store or App Store now. Also, experience web trading with advanced trading tools such as pro charting, various order types, and portfolio tracker only at Pintu Pro.
Also Read: 5 Secrets of Today’s World Gold Price in the Forex Market, Crypto Investors Must Read!
*Disclaimer
This content aims to enrich readers’ information. Pintu collects this information from various relevant sources and is not influenced by outside parties. Note that an asset’s past performance does not determine its projected future performance. Trading crypto carries high risk and volatility, always do your own research and use cold hard cash beforeinvesting. All activities of buying and selling Bitcoin (BTC) and other crypto asset investments are the responsibility of the reader.
Reference
- NewsBTC. Bitcoin Price Surge To $500,000? Here’s When This Analyst Predicts It Will Happen. Accessed on February 27, 2026