Polygon (POL) Plunges 11%! Test Rp15,152, Critical Support or Start of Deeper Correction?

Jakarta, Pintu News – The price of Polygon has dropped around 11% in the last 24 hours and is now approaching the crucial demand zone of USD 0.90 or around Rp15,152 (exchange rate 1 USD = Rp16,835). This drop has sparked continued concerns in the crypto market, especially since the level has previously repeatedly been an area of price bounces. With technical indicators and on-chain data showing mixed signals, cryptocurrency players are now waiting to see if this zone can withstand the selling pressure.
1. USD 0.90 (IDR15,152) Zone to Determine Direction
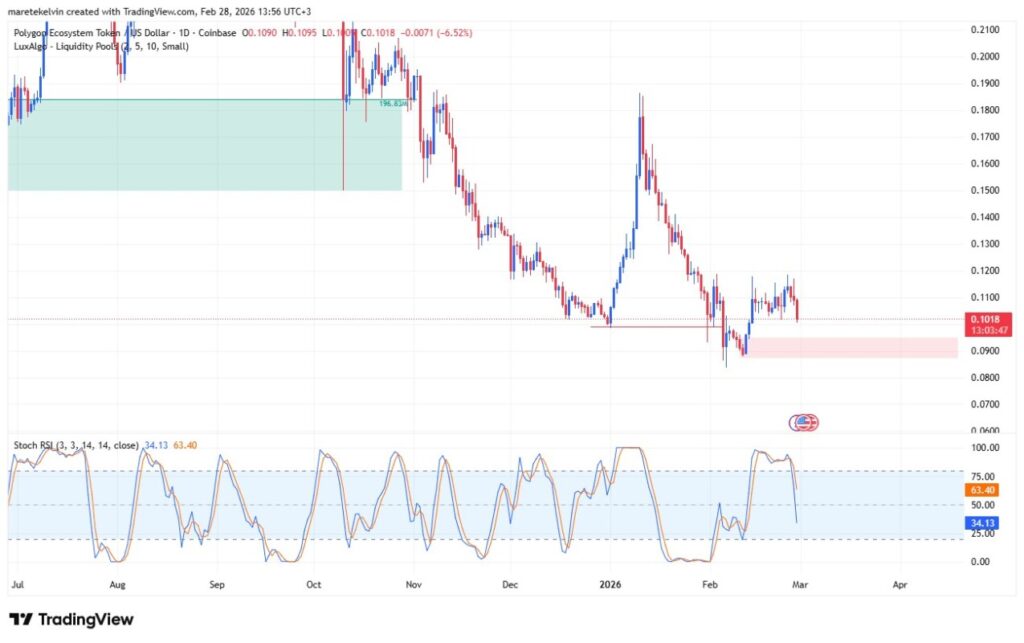
The USD 0.90 level has served as strong support in recent weeks. On the daily chart, this area triggered technical rebounds several times when prices approached it. However, the more often the support is tested, the greater the risk of weakening it.
If POL prices break below IDR15,152, the chances of a further decline are wider. A downward breakout could trigger additional selling from short-term traders. Conversely, if buyers are able to defend this area, short-term rebound opportunities remain.
The RSI stochastic indicator began to approach the oversold area, signaling that selling pressure was starting to weaken. This condition often signals a potential technical bounce. However, confirmation is still needed through volume and subsequent price movements.
Also Read: 5 Important Things About Gold Bullion, the Most Solid Safe Haven Instrument Other Than Crypto!
2. Reserves on the Exchange Stable, Selling Pressure Easing?
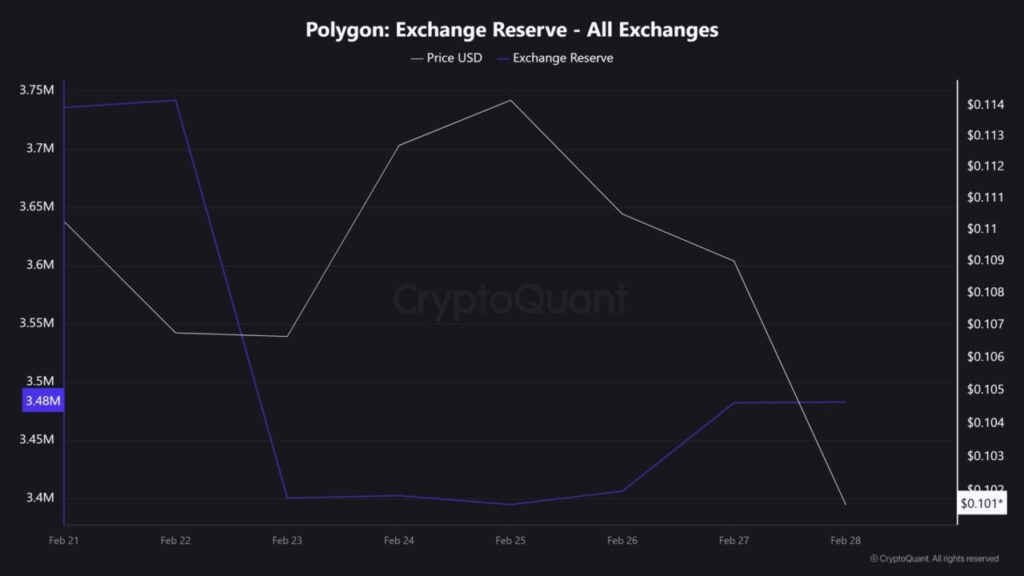
On-chain data shows Polygon (POL) reserves on crypto exchanges are stabilizing. The inflow of tokens to exchanges is slowing down, which usually indicates a reduction in instant selling pressure. In the crypto context, a decrease in reserves on exchanges is often considered a positive signal.
However, stabilization alone is not enough to reverse the trend. Prices need a real increase in demand in order to recover significantly. Without a boost in buying volume, POL has the potential to move sideways in the short term.
The combination of reserve stabilization and buying in the support zone could be the catalyst for a rebound. If both happen together, selling pressure could ease faster. However, if demand remains weak, the risk of a breakdown remains.
3. Mixed On-Chain Signal, Investors Wait and See
POL withdrawal activity from the network has decreased dramatically in the last 24 hours. This suggests that some investors are choosing to hold their assets rather than sell. In the cryptocurrency market, a wait-and-see attitude often emerges when prices approach important support.
On the other hand, the average inflow into the bourse also declined sharply. This reduced the potential for immediate selling pressure, but could also reflect low buying interest. This creates mixed sentiment that increases short-term volatility.
If buying interest increases along with oversold signals, the chances of a technical rebound will be stronger. However, if selling pressure reappears, the support of IDR15,152 could be broken. Movement in this area will determine the direction of the next POL trend.
4. What Does It Mean for Crypto Investors?
For crypto investors, the USD 0.90 zone is a crucial point in risk management. A break below this level could trigger a deeper correction, while a strong bounce could open up short-term trading opportunities. Discipline towards support and resistance levels is essential.
The movement of Polygon (POL) also reflects the dynamics of the altcoin amid volatile market conditions. As with Bitcoin and Ethereum , macro sentiment and global liquidity continue to influence price direction. Therefore, monitoring technical and on-chain indicators simultaneously is a wiser strategy.
Overall, POL is now at an important junction. The IDR15,152 zone will be the main stronghold before a potential further decline. The market reaction in the next few sessions will determine whether this is just a temporary correction or the start of a longer bearish phase.
Also Read: 5 Advantages of Pegadaian Gold Deposit
Follow us on Google News to stay up to date with the latest in crypto and blockchain technology. Check Bitcoin price, usdt to idr and tokenized nvidia stock price via Pintu Market.
Enjoy an easy and secure crypto trading and crypto gold investment experience by downloading the Pintu crypto app via Play Store or App Store now. Also, experience web trading with advanced trading tools such as pro charting, various order types, and portfolio tracker only at Pintu Pro.
*Disclaimer
This content aims to enrich readers’ information. Pintu collects this information from various relevant sources and is not influenced by outside parties. Note that an asset’s past performance does not determine its projected future performance. Trading crypto carries high risk and volatility, always do your own research and use cold hard cash beforeinvesting. All activities of buying and selling Bitcoin (BTC) and other crypto asset investments are the responsibility of the reader.
Reference
- AMBCrypto. Polygon drops 11% – Can POL’s $0.90 demand zone stop more losses? Accessed on March 2, 2026.