Ethereum Jumps 7% Today as Smart DCA Signals and Chart Patterns Fuel Market Optimism

Jakarta, Pintu News – The long-term “Smart DCA” signal for Ethereum has strengthened again, touching areas similar to the previous zones that had appeared in the previous accumulation phase. At the same time, the Ethereum chart on March 4 shows ETH forming a series of higher lows, while repeatedly testing the resistance zone around $2.1K.
Then, how will Ethereum price move today?
Ethereum Price Up 7.41% in 24 Hours
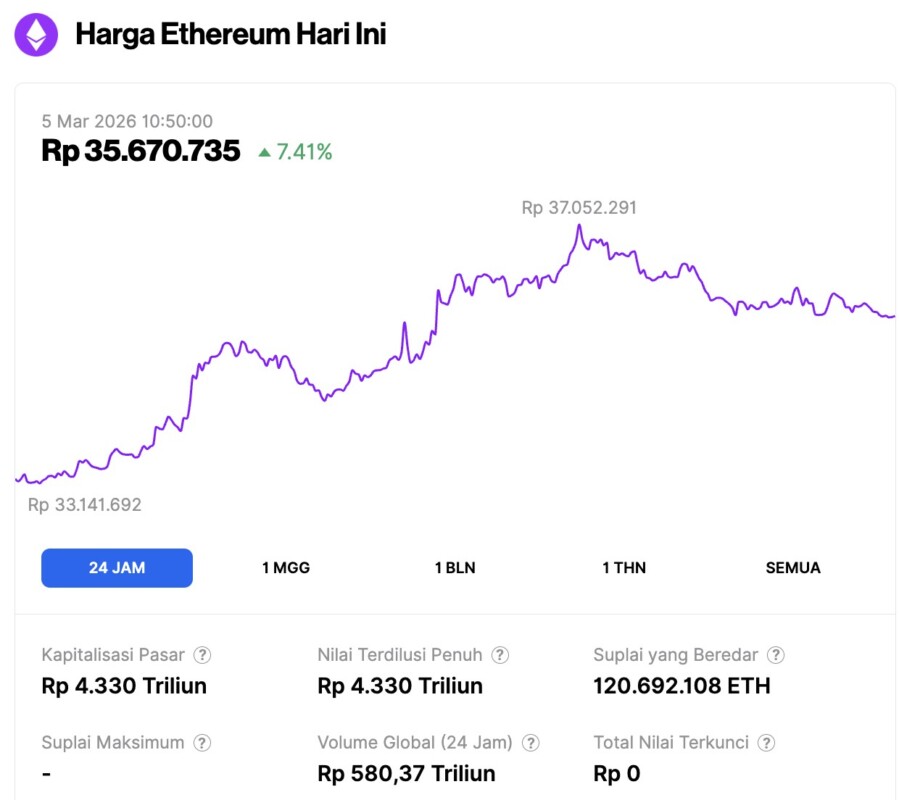
On March 5, 2026, Ethereum (ETH) was trading at about $2,112, or roughly IDR 35,670,735, up 7.41% over the past 24 hours. During that window, ETH dipped to a low of IDR 33,141,692 and climbed as high as IDR 37,052,291.
At the time of writing, Ethereum’s market capitalization was approximately IDR 4,330 trillion, while daily trading volume rose 40% to around IDR 580.37 trillion over the same 24-hour period.
Read also: PMI Breaks 50, Altcoins Ready to Rise? Altcoin Season 2026 Signals Begin to Emerge
Ethereum’s “Smart DCA” Indicator Hints at an Accumulation Phase
A long-term Ethereum chart that analyst James Easton shared on X highlights a spike in the “Smart DCA” indicator, which has historically appeared during periods of market accumulation. The chart overlays Ethereum’s price movements with a number of moving averages, including MA7, MA14, MA21, MA50, MA90, MA116, MA200, MA365, and MA720.
The chart also marks previous moments when the indicator was active. These areas are shown as blue circles in some of the previous market cycles. In some of these periods, the signals aligned with the price consolidation phase that preceded a larger upward movement.
At the bottom of the chart, two oscillation lines are used to track the Mega Ratio indicator. Based on analysts’ annotations, Smart DCA signals have recently accelerated, which indicates the re-emergence of accumulation behavior in the broader Ethereum market structure.
The gray vertical bands along the chart mark signal zones in the past when similar conditions have occurred. Historically, these zones coincide with transitional phases between periods of correction and recovery. The most recent signal is seen on the right side of the chart, when the indicator started rising again after having weakened in the previous period.
Read also: 3 Reasons Grayscale Believes Now is the Right Time for Long-Term Crypto Investments
Ethereum Tests Key Resistance as Price Forms Higher Low
Meanwhile, the 4-hour Ethereum chart (4/3) that analyst Daan Crypto Trades shared on X shows the price attempting to move up gradually while maintaining a series of thin higher lows. The chart depicts a consolidation structure, where ETH fluctuates between a defined support area and a resistance zone above it.
The upper area around $2,100 is seen as a major resistance on the chart. A number of candles had approached this level in the last few sessions, but failed to close above it, so the wider range of movement remains intact. Based on analysts’ annotations, this zone is a level on the higher time frames that the bulls need to break in order to shift the short-term momentum.
On the other hand, the chart marks support near the lower limit, around the $1,800 area. The price previously bounced off that level after a sharp decline, which then formed the lower limit of the current trading range.
After that, the candles form a gradual higher low while repeatedly testing the top of the range. This pattern indicates a slowly increasing upside pressure, although the resistance is still holding the upside until a confirmed breakout occurs.
Follow us on Google News to stay up to date with the latest in crypto and blockchain technology. Check Bitcoin price, usdt to idr and tokenized nvidia stock price through Pintu Market.
Enjoy an easy and secure crypto trading and crypto gold investment experience by downloading the Pintu crypto app via Play Store or App Store now. Also, experience web trading with advanced trading tools such as pro charting, various order types, and portfolio tracker only at Pintu Pro.
*Disclaimer
This content aims to enrich readers’ information. Pintu collects this information from various relevant sources and is not influenced by outside parties. Note that an asset’s past performance does not determine its projected future performance. Crypto trading activities are subject to high risk and volatility, always do your own research and use cold hard cash before investing. All activities of buying and selling Bitcoin and other crypto asset investments are the responsibility of the reader.
Reference:
- Coinpaper. Ethereum Price Prediction: Smart DCA Signals Push ETH Toward $2.1K. Accessed on March 5, 2026


