7 BTC Warning Points at Rp1.23 Billion in March 2026

Jakarta, Pintu News – The crypto market is in turmoil again as Bitcoin reclaims the psychological $73,000 level amid rising geopolitical volatility. This rise sparked a debate: whether the rally marks a potential price bottom, or simply a temporary bounce before a further correction. A number of indicators and analyst comments highlight both opportunities and risks for cryptocurrency investors.
1. BTC rebounds to $73,000 after being hit by geopolitical volatility
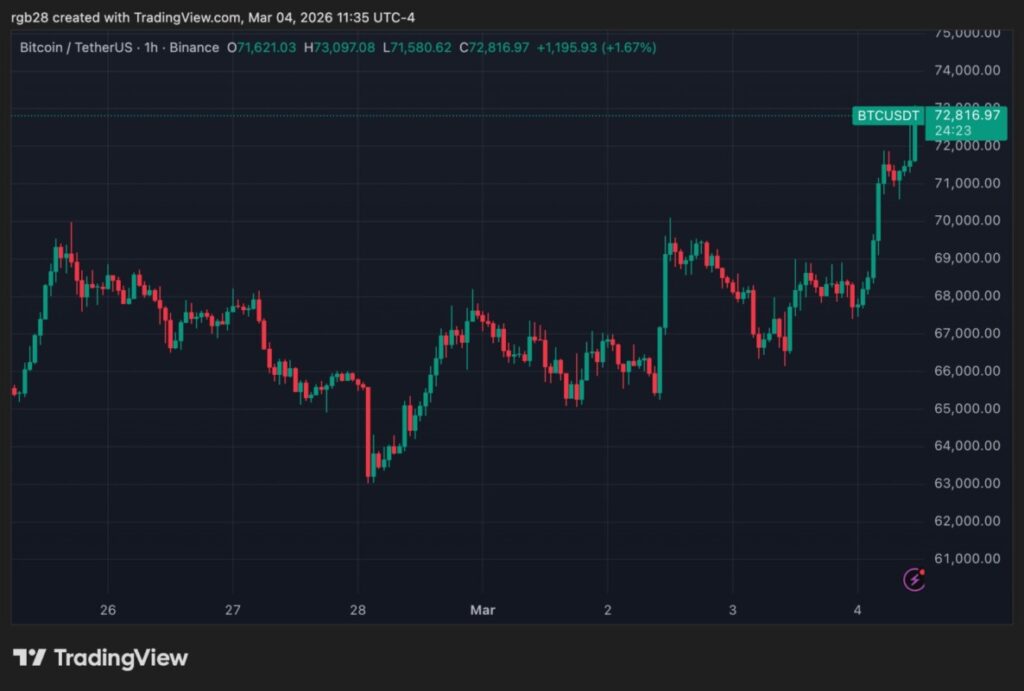
Bitcoin (BTC) reportedly surged 8.3% and briefly breached $72,000 for the first time in a month. This movement came after a sell-off triggered by the escalation of the Middle East conflict, which pressured risky assets including cryptocurrencies. BTC had previously dropped to $63,000 before prices stabilized and gradually recovered.
If converted at an exchange rate of 1 USD = IDR 16,919, these key daily movement levels are equivalent to the following rupiah range. This data helps you read the context of volatility without getting hung up on dollar figures alone. To summarize, BTC moved quickly from the Rp1.07 billion area to the Rp1.24 billion area in a short period of time.
- $63,000 ≈ Rp1,065,897,000
- $72,000 ≈ Rp1,218,168,000
- $73,000 ≈ Rp1,235,087,000
- Intraday peak $73,479 ≈ Rp1,243,191,201
Also Read: Czech Central Bank seeks 100 tons of gold reserves, Bitcoin (BTC) is still under consideration
2. The $63,000-$73,000 Range Has Been the Main Stage Since February
Since early February, Bitcoin (BTC) is said to have moved in a range of $63,000-$73,000 and has struggled to stay above $70,000 at times. This range pattern is relevant because it shows a market that is sensitive to external catalysts, especially when risk-off sentiment increases. In terms of crypto market analysis, range conditions often signal a liquidity tug-of-war before the next trend direction is established.
After touching $63,000 at the weekend, the price is said to have quickly stabilized in the middle area of the range and then reclaimed $68,000 earlier in the week. From that low, BTC recorded a rise of around 15.87% towards a one-month high. However, quick rallies within the range also often bring up the risk of “false breakouts” when the news flow changes.
3. Liquidity Signals and ETFs: Notable Short-Term Support
In the quoted podcast discussion, there is a view that BTC’s resilience and signs of liquidity influx could be a good “setup” for the price bottom formation process. On the other hand, cryptocurrency markets often require repeated confirmation as volatility can increase at any time. Therefore, capital flow data is usually read as an indication rather than a certainty.
Another highlight comes from the performance of the US spot Bitcoin ETF which is said to have recorded inflows of $683.34 million in the two days since Monday. If converted, the value is around IDR11,561,429,460,000, which can be read as the demand for BTC-based investment products strengthening again. Even so, ETF inflows still need to be read alongside macro conditions, including changes in institutional leverage.
4. Warning: “Too Early” to Call Bottom in a Fragile Market
One market analyst called the situation still “too fragile” to declare a bottom, as the increased volatility of stock indices may force institutional investors to reduce leverage. In crypto dynamics, reduced leverage often magnifies price swings and accelerates liquidation when the market reverses. This means that rallies that look strong could still be short-lived if global risk conditions worsen.
Other comments suggest that some market participants may start to see crypto as an alternative when other assets take a hit, although this narrative is not always stable. In practice, Bitcoin (BTC) can be alternately treated as a risky asset or a “hedge” depending on the market phase. Therefore, one-day rally readings should not be used as the sole basis for decisions.
5. Ted Pillows Scenario: 20-25% Rally Then Deep Correction
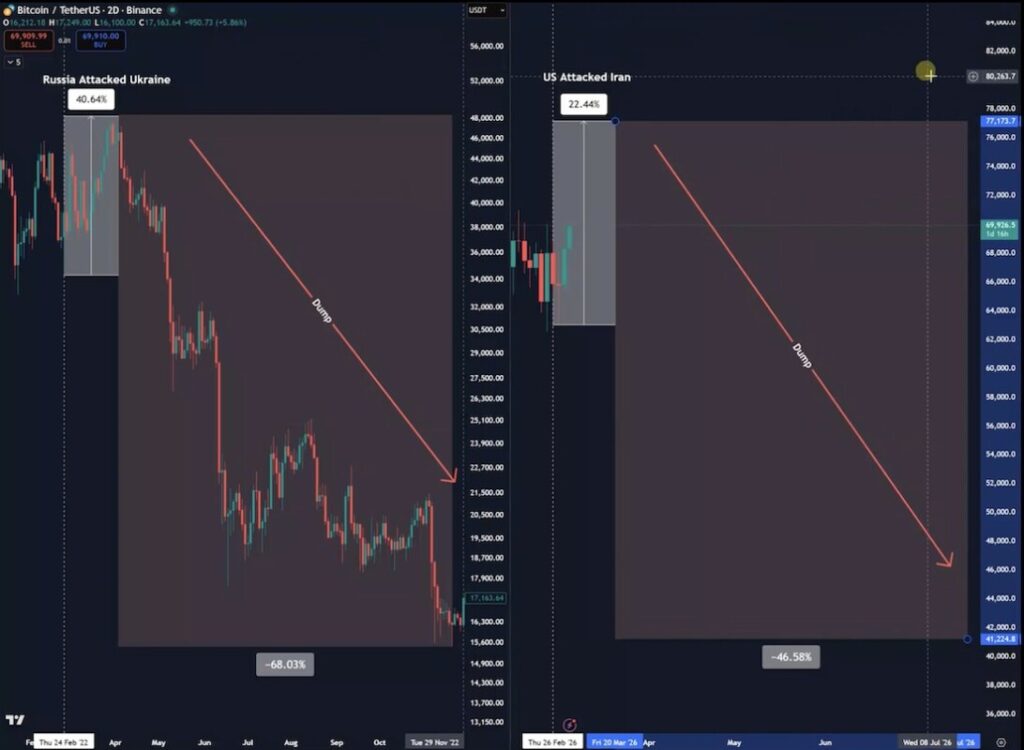
One market watcher compared current conditions to early 2022 when the Russia-Ukraine war triggered major volatility. At that time, BTC had rallied about 40% in a month, then fell about 67% according to the comparison cited. This analogy pattern is used to emphasize that post-geopolitical turmoil rallies can reverse sharply.
In the so-called scenario, BTC could potentially rally 20%-25% towards the $78,000-$80,000 area before facing strong rejection in the area. After the potential peak, there is a risk of a subsequent down phase that could bring a correction of up to 45% from the rally peak. If the target figure of $40,000 is used as an illustration, the level is equivalent to around IDR 676,760,000.
6. MVRV Zone: A Frequently Monitored “Historical Bottom” Area
Another analysis cites the MVRV Pricing Bands indicator, which states that BTC has historically formed a bottom between the 1.0 and 0.8 bands. Based on the levels mentioned, that zone is at $43,647-$54,559 or around Rp738,463,593-Rp923,083,721. This figure is not an exact prediction, but a probabilistic reference of cryptocurrency investor behavior over several cycles.
At around $73,255 (≈ Rp1,239,401,345) at the time of writing, BTC is still well above the MVRV zone. This is in line with the warning that the market may not have touched the area often associated with “capitulation”. For you, the main context is to separate the “strong rebound” from the “bottom confirmation” which usually takes time and multi-indicator validation.
Also Read: The Might of the US Dollar: De-Dollarization Fails, Other World Currencies are Out!
Follow us on Google News to stay up to date with the latest in crypto and blockchain technology. Check Bitcoin price, usdt to idr and tokenized nvidia stock price through Pintu Market.
Enjoy an easy and secure crypto trading and crypto gold investment experience by downloading the Pintu crypto app via Play Store or App Store now. Also, experience web trading with advanced trading tools such as pro charting, various order types, and portfolio tracker only at Pintu Pro.
*Disclaimer
This content aims to enrich readers’ information. Pintu collects this information from various relevant sources and is not influenced by outside parties. Note that an asset’s past performance does not determine its projected future performance. Trading crypto carries high risk and volatility, always do your own research and use cold hard cash beforeinvesting. All activities of buying and selling Bitcoin (BTC) and other crypto asset investments are the responsibility of the reader.
Reference
- Rubmar Garcia/NewsBTC. Bitcoin Reclaims $73,000 Amid Iran War Volatility, But Analyst Issues Key Warning. Accessed March 6, 2026.