Bitcoin Price Rises to $73,000 Today: What’s Next for BTC?

Jakarta, Pintu News – Bitcoin is currently showing mixed signals. On the one hand, long-term indicators point to a broader market cycle recovery. On the other hand, short-term charts are warning that resistance levels are still an important obstacle.
Combined, these two signals suggest that the market still has the potential to continue rising in the longer term, but first it must be able to pass a crucial test in the near future.
Then, how will the Bitcoin price move today?
Bitcoin Price Up 2.00% in 24 Hours
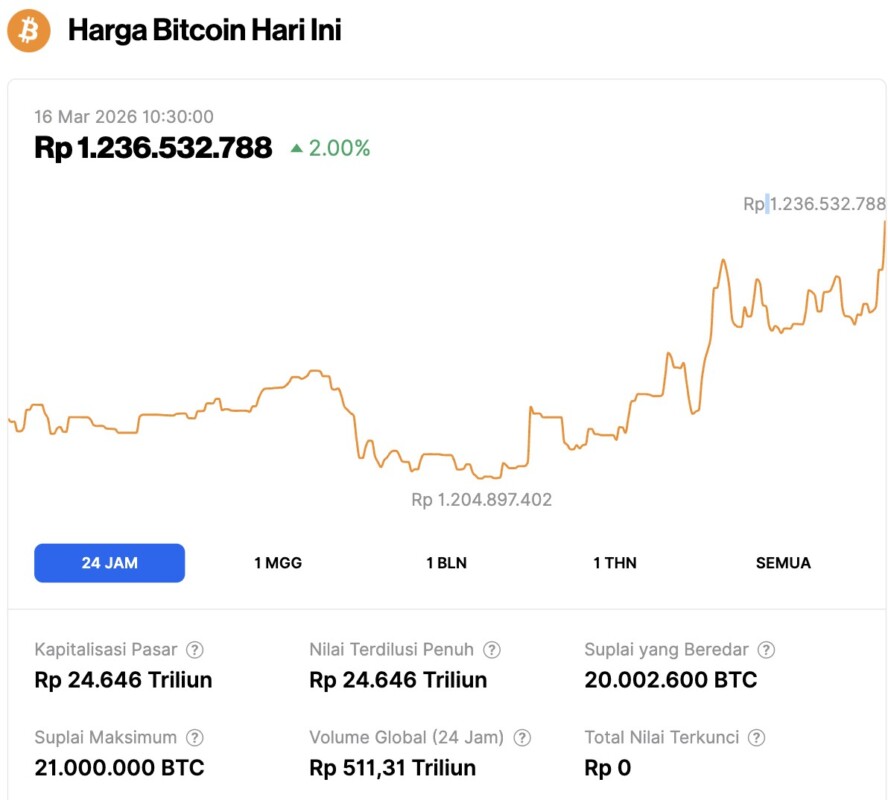
On March 16, 2026, Bitcoin traded at $73,476, equivalent to IDR 1,236,532,788, marking a 2.00% gain over the past 24 hours. Within that period, BTC fell to a low of IDR 1,204,897,402 before climbing to a daily high of IDR 1,236,532,788.
At the time of writing, Bitcoin’s market capitalization stood at approximately IDR 24,646 trillion, while 24-hour trading volume surged 37% to IDR 511.31 trillion.
Read also: 5 Altcoins That Were Once Popular and Could Make a Comeback in 2026
Bitcoin MVRV Z Score Shows Cyclical Patterns
A long-term Bitcoin chart shared by analyst Ali Martinez shows that a number of bull markets in previous cycles started after the MVRV Z Score dropped to very low levels. This indicator compares Bitcoin’s market value to its realized value, and has historically been used to identify periods when an asset’s price is trading below an investor’s average cost of accumulation.
Based on the chart, the MVRV Z Score has touched the -0.262 range at several previous market cycle bottoms. This was seen in several previous periods, including when the market formed bottoms around 2015, 2019, and 2022. After each of these signals, Bitcoin eventually entered a new bullish phase followed by large-scale price expansion.
The visual shows a comparison between the orange MVRV Z Score line and the Bitcoin price trend shown in black. In previous cycles, the indicator dipped into the negative area before recovering as the price rose. Such phases reflect periods when selling pressure begins to ease and long-term accumulation begins to emerge in the market.
However, the same chart also shows that the indicator usually doesn’t stay at these extreme levels for long. When the market starts to recover, the Z Score tends to move up quickly. In the later stages of the cycle, the indicator often reaches high positive levels when the market starts to overheat.
In the current market structure, the MVRV Z Score is above historical bottom levels, but still well below the peaks seen in previous cycles. This position indicates that the market is no longer in the zone of deep undervaluation as it was during the formation of the previous major bottom. However, it also does not yet reflect an overheated market as is usually the case towards the top of a cycle.
Read also: 3 Crypto Standouts in Week 2 of March 2026, Potential for Breakout?
As such, it suggests that Bitcoin is currently in an intermediate phase within a larger market cycle, rather than at an extreme turning point. The chart confirms that the MVRV Z Score has repeatedly been an important reference in marking major changes in market sentiment over the past few years.
Bitcoin Relief Bounce Faces Important Fibonacci Resistance
Bitcoin is attempting a short-term recovery after suffering a sharp drop in the previous chart structure. The 12-hour chart shared by analyst Elja shows the price bouncing off its latest low, but this move is now approaching an important Fibonacci resistance zone that previously served as support.
In the chart, the 0.5 Fibonacci level is around $75,220 and the 0.618 level is around $78,819. Both are major areas of resistance. These levels are taken from the broader retracement of the previous downward movement. As such, this zone now has the potential to be an upper limit for as long as the recovery phase lasts.
In the previous down phase, Bitcoin dropped through the same retracement level after failing to defend the upper area around the mid-$90,000s. After the breakdown occurred, the market moved down faster before finally stabilizing and forming a consolidation area.
The current price bounce brings Bitcoin back close to these retracement levels. In technical analysis, old support areas often turn into resistance after the price breaks them down. Therefore, the $75K to $78K area is now the next obstacle for the market to overcome.
Elja thinks that if Bitcoin fails to reclaim this zone, the price rejection could trigger another leg down. In that scenario, projections on the chart suggest a possible move towards the $56,000 to $60,000 range, which is well below the current recovery area.
For the time being, the market structure suggests that Bitcoin is testing whether this bounce can develop into a stronger recovery. Nevertheless, the Fibonacci resistance zone remains a key technical level that will most likely determine the direction of the next market movement.
Follow us on Google News to stay up to date with the latest in crypto and blockchain technology. Check Bitcoin price, usdt to idr and tokenized nvidia stock price through Pintu Market.
Enjoy an easy and secure crypto trading and crypto gold investment experience by downloading the Pintu crypto app via Play Store or App Store now. Also, experience web trading with advanced trading tools such as pro charting, various order types, and portfolio tracker only at Pintu Pro.
*Disclaimer
This content aims to enrich readers’ information. Pintu collects this information from various relevant sources and is not influenced by outside parties. Note that an asset’s past performance does not determine its projected future performance. Crypto trading activities are subject to high risk and volatility, always do your own research and use cold hard cash before investing. All activities of buying and selling Bitcoin and other crypto asset investments are the responsibility of the reader.
Reference:
- Coinpaper. Bitcoin Price Prediction: MVRV Cycle Strength Meets $75K-$78K Test. Accessed on March 16, 2026