Solana’s $95 Crossroad: A Genuine Recovery or a Calculated Trap for Investors?
Jakarta, Pintu News – The price of Solana does not appear to have moved significantly, but this does not reflect a calm market. Despite the apparent stability, the pressure is mounting. The latest liquidation map data shows that the market is currently filled with highly leveraged positions, so the potential for a squeeze is just waiting to be triggered.
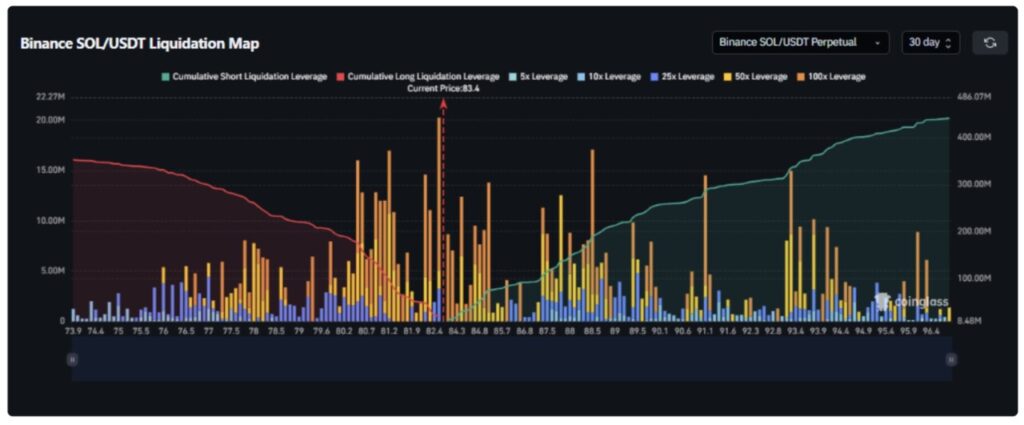
At around $83.40, the Solana price is in what market participants often refer to as a “neutral zone”. But in reality, it’s more like a battlefield waiting for a trigger. The trigger is hundreds of millions of dollars in leveraged positions that could potentially be liquidated at any time.
Short Sellers Are Under Great Pressure
This is where the market dynamics become interesting to watch. Liquidation data shows a significant imbalance, with short positions recorded at around $441 million versus $353 million for long positions.
Read also: Pi Network Releases Major Upgrade, Price Hasn’t Moved: Time for a Breakout or More Lethargy?
Currently, more market participants are taking short positions against the Solana price. Under these conditions, the market tends to move in the opposite direction to create maximum pressure for the majority of positions.
If the SOL price increases, the shorts will not only incur losses, but will also be forced to buy back to cover their positions. This is known as a classic short squeeze. With such a large imbalance in place, it doesn’t take a big push to trigger a rapid price movement.
The $86 to $95 zone is a vulnerable spot
On closer inspection, the market structure shows a fairly dense cluster of short liquidations starting from the $86.80 level, with the highest concentration in the $93.40 to $95.40 range. This zone acts like a magnet. Not as resistance in the conventional sense, but as a liquidity target.
If Solana prices manage to break the $85 level, then the move towards $95 has the potential to be fast and aggressive. This is not driven by an influx of new buyers, but rather by buy-backs from trapped shorts that are forced to chase price increases.
But to be clear, this does not reflect strong bullish conviction. The movement is more mechanical in nature triggered by liquidation pressure.
Downside Risk Also Open, Long Positions Exposed
On the other hand, the chart structure also shows risks in the downside direction. There is a fairly dense concentration of liquidation of long positions in the range of $78.50 to $80.20.
If the Solana price corrects and enters this range, then the potential for a long squeeze is wide open, which is a similar chain effect but to the downside. This could push the price down further towards the $74 area. Thus, the risk is not only on the bears’ side. The bulls are also currently in a vulnerable situation.
Read also: 5 Reasons Stellar (XLM) Will Reach IDR 17,128 in 2030, Investors Must Know!
Market Compressed Between Two Liquidation Zones
Currently, Solana’s price is stuck between two major liquidation clusters, at $78 on the downside and $95 on the upside. This reflects a classic compression pattern.
Such patterns generally do not end without significant volatility. Coupled with the presence of high-risk 50x and 100x leveraged positions around the $82.40 level, the potential for sudden spikes in volatility is even greater. A price movement of just a few dollars can massively liquidate positions, triggering a chain effect throughout the market.
So, what is the next projection? Based on the existing liquidity structure, the path of least resistance is currently trending upwards. The liquidity that can be unlocked through squeezing short positions is greater than liquidating long positions.
However, probability cannot be equated with certainty. In a market with this level of leverage, Solana’s price movements are not based solely on fundamental logic, but rather on the point at which the greatest pressure can be exerted on the majority of positions.
Follow us on Google News to stay up to date with the latest in crypto and blockchain technology. Check Bitcoin price, usdt to idr and tokenized nvidia stock price through Pintu Market.
As a safe crypto app, Pintu provides a crypto trading experience to access crypto gold investment easily and conveniently. You can also see today’ s gold jewelry price and today’s gold bullion price to support your investment activities and portfolio diversification as well as learn crypto through Pintu Academy.
Download the Pintu crypto app via Play Store or App Store now. Enjoy the web trading experience with various advanced trading tools such as pro charting, various types of order types, and portfolio tracker only at Pintu Pro.
*Disclaimer
This content aims to enrich readers’ information. Pintu collects this information from various relevant sources and is not influenced by outside parties. Note that an asset’s past performance does not determine its projected future performance. Crypto trading activities are subject to high risk and volatility, always do your own research and use cold hard cash before investing. All activities of buying and selling Bitcoin and other crypto asset investments are the responsibility of the reader.
Reference:
- Coinpedia. Solana Price Outlook: Liquidation Map Signals a $95 Trap. Accessed on April 17, 2026


