Bitcoin (BTC) Struggles to Find Momentum Amid Global Conflict Tensions

Jakarta, Pintu News – Bitcoin price has recently started an upswing from the $104,500 support zone. The cryptocurrency managed to break the $105,500 and $106,200 levels, entering the positive zone. Despite managing to surpass the $108,000 resistance, pressure from sellers is still being felt amid rising fears of global conflicts. The price peak was recorded at $108,898 before it started to correct.
There was a drop below the $108,000 level, and the price of Bitcoin (BTC) fell below the 23.6% Fibonacci retracement level of the upward move from $104,529 to $108,898. In addition, there was also a breakdown of the bullish trend line with support at $107,800 on the hourly chart of the BTC/USD pair. Currently, Bitcoin (BTC) is trading above $106,800 and above the 100-hour simple moving average.
Bitcoin (BTC) Price Increase Potential
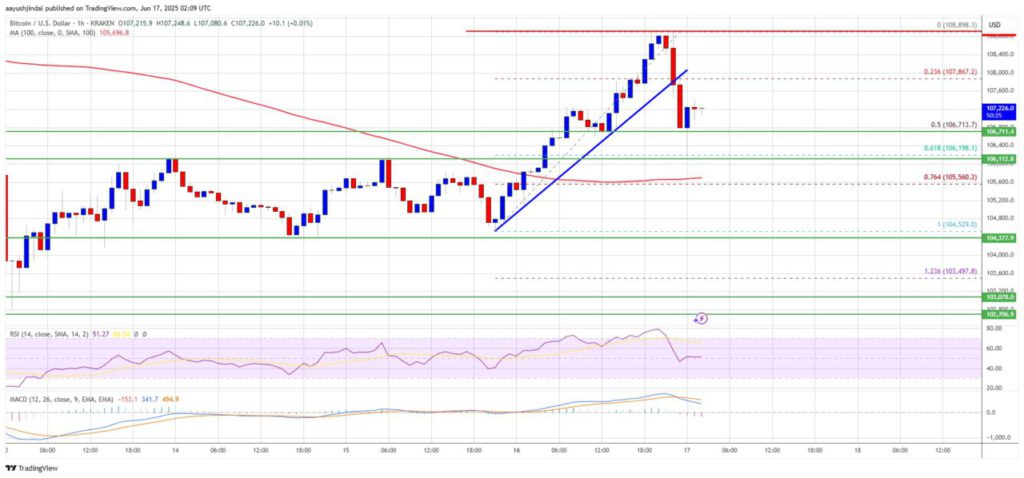
On the upside, immediate resistance is near the $107,600 level. The first key resistance is near the $108,000 level. The next key resistance may be at $108,800. A close above the $108,800 resistance could push the price even higher. In that scenario, the price could rise and attempt the $110,000 resistance level. A further increase might push the price towards the $112,000 level.
This resistance is key for investors and market watchers to predict the next direction of the Bitcoin (BTC) price. If it is able to break the resistance, it could be a strong bullish signal for traders and might attract more buyers into the market.
Also Read: Bitcoin (BTC) Hits a New Low, What’s the Impact on the Market? (6/18/25)
Possibility of Further Decline
If Bitcoin (BTC) fails to break the $108,000 resistance zone, there is a possibility that the price will drop again. Immediate support is near the $106,700 level and the 50% Fibonacci retracement level of the upward move from $104,529 to $108,898. The first major support is near the $106,200 level.
The next support is currently at the $105,500 zone. A further drop could push the price towards the $103,500 support in the short term. The key support is at $102,000, below this, Bitcoin (BTC) may gain bearish momentum.
Technical Indicators
The hourly MACD is currently showing increased speed in the bearish zone. This suggests that there may be more selling pressure to come if this trend continues. Investors and analysts should keep an eye on this indicator for further clues on potential price movements.
The hourly RSI (Relative Strength Index) for BTC/USD is currently near the 50 level, indicating that the market is currently in a relatively balanced state between buyers and sellers. However, a move below or above this level could give a clearer signal about the direction of the next trend.
Conclusion
With market conditions constantly changing and influenced by various global factors, Bitcoin (BTC) investors and traders must remain vigilant. Observing technical indicators and support and resistance levels will be crucial in determining the right trading strategy in the days ahead.
Also Read: Global Tensions Heat Up, Crypto Takes a Hit: What Really Happened? (6/18/25)
That’s the latest information about crypto. Follow us on Google News for the latest crypto and blockchain technology updates. Enjoy an easy and secure crypto trading experience by downloading Pintu crypto app via Google Play Store or App Store now.
Experience web trading with advanced trading tools such as pro charting, various order types, and portfolio tracker only at Pintu Pro. Pintu Pro Futures is also available, where you can buy bitcoin leverage, trade btc futures, eth futures and sol futures easily from your desktop!
*Disclaimer
This content aims to enrich readers’ information. Pintu collects this information from various relevant sources and is not influenced by outside parties. Note that an asset’s past performance does not determine its projected future performance. Crypto trading activities are subject to high risk and volatility, always do your own research and use cold hard cash before investing. All activities of buying andselling Bitcoin and other crypto asset investments are the responsibility of the reader.
Reference
- NewsBTC. Bitcoin Price Struggles Near $108K. Accessed on June 18, 2025
- Featured Image: Generated by AI