Hyperlane Crypto Skyrockets 150% After Listing on Upbit!
Jakarta, Pintu News – Hyperlane crypto prices have been on a steady decline since April, with values shrinking by more than 70%.
Promising signs started to appear in July, when HYPER prices formed some slightly higher lows.
Hyperlane then experienced a parabolic surge on July 10, fueled by a rally triggered by listing on Upbit, South Korea’s largest exchange.
With that background, let’s analyze HYPER’s price movement and see where this rally will take us.
Hyperlane Crypto Breaks the Limit
According to CCN (10/7), weekly analysis shows that Hyperlane’s price managed to break the descending resistance trend line before today’s rally, which was triggered by the listing on Upbit.
Read also: Ripple Price Prediction: Can XRP Reach $3.30 by the End of the Month?
Nevertheless, today’s breakout was a key determinant in Hyperlane crypto analysis, as it managed to negate more than three months of bearish price movement.
Although the current price movement is clearly showing bullish signals, the failure to close above the horizontal resistance area of $0.270 is a less encouraging signal for the trend ahead.
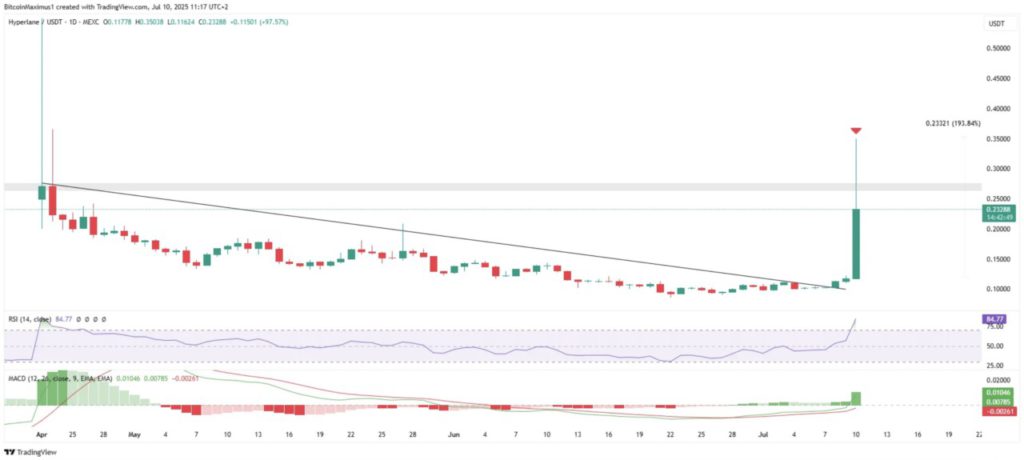
Instead of breaking the boundary, HYPER formed a long upper wick (red icon) and is now trading below that area.
Momentum indicators are showing overbought signals. TheRelative Strength Index ( RSI) and Moving Average Convergence/Divergence (MACD) are at their highest points in recent months.
However, none of them have shown bearish divergence yet, which is a positive sign for the outlook ahead.
However, the most crucial part of the HYPER price movement is found in these daily candlesticks.
Looking at the analysis in a 2-hour time span can give a clearer picture of the Hyperlane’s next direction of movement.
Correction Before Reaching New Highs
The two-hour chart (10/7) shows that the HYPER rally started on June 22, when the price formed a diagonal leading pattern.
This trend strengthened further in July, which became the foundation for the parabolic spike to new highs.
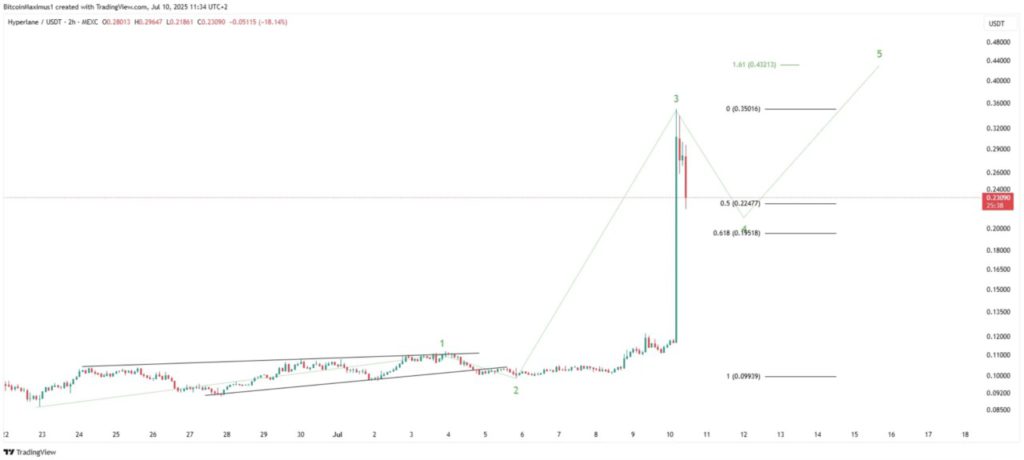
This rise in the crypto hyperlane is the third wave in a five-wave bullish pattern (marked in green), and the price is currently undergoing a correction in the fourth wave.
Since HYPER price has reached the 0.5 Fibonacci retracement level as a support area, the correction may be over. Even so, the price could still touch the 0.618 Fibonacci level at $0.195. After that, the main target for the peak of this movement is at $0.432.
Read also: PEPE Coin Price Breaks Wedge Pattern, Ready to Jump 50%? Here’s the Chart Prediction!
Although this calculation will not take HYPER to a new all-time high, the development remains very positive, as HYPER will manage to close above the $0.270 resistance area.
Bullish Predictions for Hyperlane Crypto
Hyperlane’s price jumped more than 150% after South Korean exchange Upbit listed the token today.
Although the listing was the main trigger for this sharp spike, the HYPER trend was already bullish even before the breakout.
Analysis shows that HYPER is currently undergoing a short-term correction, but another bounce is expected in the long term.
That’s the latest information about crypto. Follow us on Google News to stay up-to-date on the world of crypto and blockchain technology.
Enjoy an easy and secure crypto trading experience by downloading Pintu crypto app via Google Play Store or App Store now. Get a web trading experience with advanced trading tools such as pro charting, various types of order types, and portfolio tracker only at Pintu Pro. Pintu Pro Futures is also available, where you can buy bitcoin leverage, trade btc futures, eth futures and sol futures easily from your desktop!
*Disclaimer
This content aims to enrich readers’ information. Pintu collects this information from various relevant sources and is not influenced by outside parties. Note that an asset’s past performance does not determine its projected future performance. Crypto trading activities have high risk and volatility, always do your own research and use cold cash before investing. All activities of buying and selling bitcoin and other crypto asset investments are the responsibility of the reader.
Reference:
- CCN. Hyperlane (HYPER) Price Pumps 150% After Upbit Listing – Here’s How Much Higher It Could Go. Accessed on July 11, 2025