Solana Price Takes a Dive, But These 3 Key Indicators Show the Uptrend is Far from Over!
Jakarta, Pintu News – Solana prices may be easing from its recent peak of $168, but the larger structure still favors the bulls.
Despite the correction to $160 (US$2.6 million), three key metrics show that this is more of a pause than a decline.
Financing Rate Remains Positive, Reflecting Bullish Sentiment
Solana’s financing rate bar is still green, indicating that long positions are dominant throughout the market.
Read also: Bitcoin Slumps after US CPI Data Recorded 2.7%! What Does It Mean for the Market?
Despite the slight price drop, traders are still paying fees to stay long, which means most expect the price to rise again.
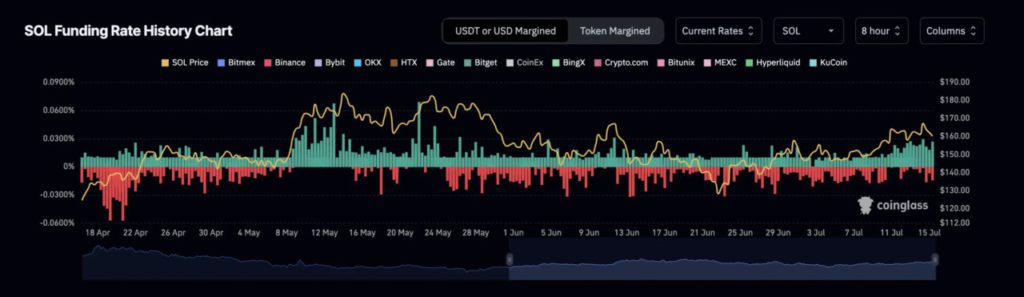
There are no signs that shorts are taking control. This usually indicates that buyers are willing to persevere through volatility.
The financing rate is the periodic payment made between long and short traders in a perpetual futures contract.
When the financing rate is positive, long positions are dominant and pay for short positions, indicating a bullish bias.
Golden Crossover 20/50 EMA Confirms Uptrend
Solana recently experienced a crossover between its 20 EMA (exponential moving average) crossing the 50 EMA on the daily chart. This golden crossover is a bullish signal indicating that short-term momentum is starting to pick up again.
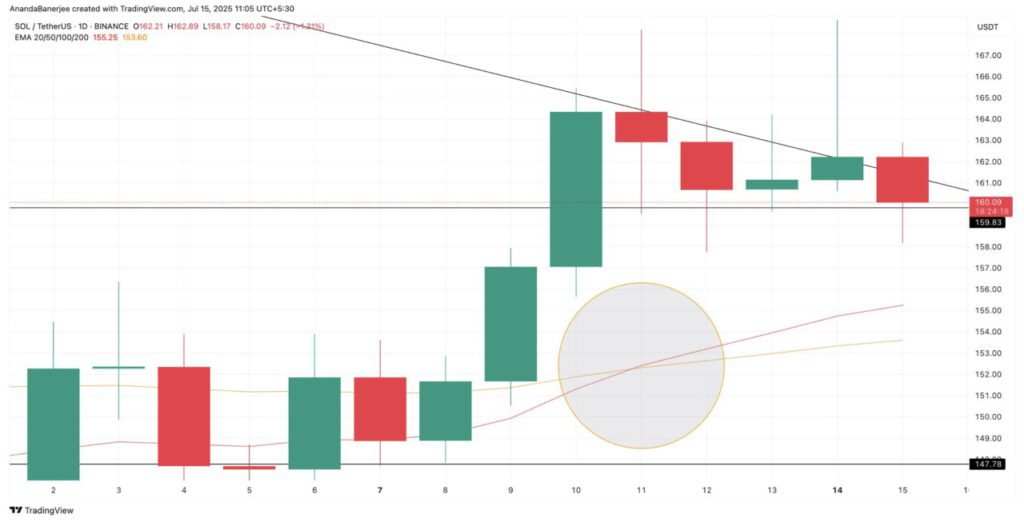
However, this crossover did not occur on a strong green candle; rather, it was on a red candle with a long wick, indicating the presence of market uncertainty.
Nonetheless, this crossover supports the idea that the SOL price trend is shifting upwards, although the momentary momentum looks unstable.
Solana Price Still Above Key Support; Structure Remains Intact
Despite the drop to $160, Solana still held above the key support zone around $158, as projected by the Fibonacci retracement indicator, a useful tool for mapping key support levels during uptrends.
Read also: Sui Predicted to Jump 3X to $10 in 2025 Crypto Bull Run?
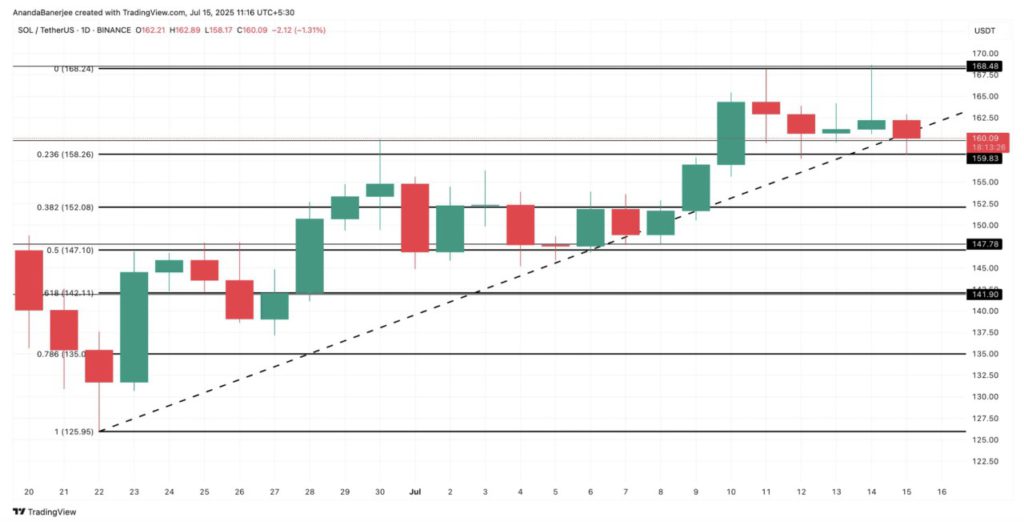
On the upside, if Solana manages to reclaim $168 (US$2.7 million), with financing rates continuing to be positive, the next leg of this rally will open up. This would allow the SOL price to reach $179 (US$2.91 million) and even $184 (US$2.99 million), provided the broader market sentiment remains bullish.
However, there was a bearish divergence on the RSI between July 10 and July 14. The SOL price printed higher peaks, but the RSI printed lower peaks; this is a sign that momentum is weakening despite the SOL price continuing to rise. These divergences often lead to short-term corrections, which is what we are currently seeing.
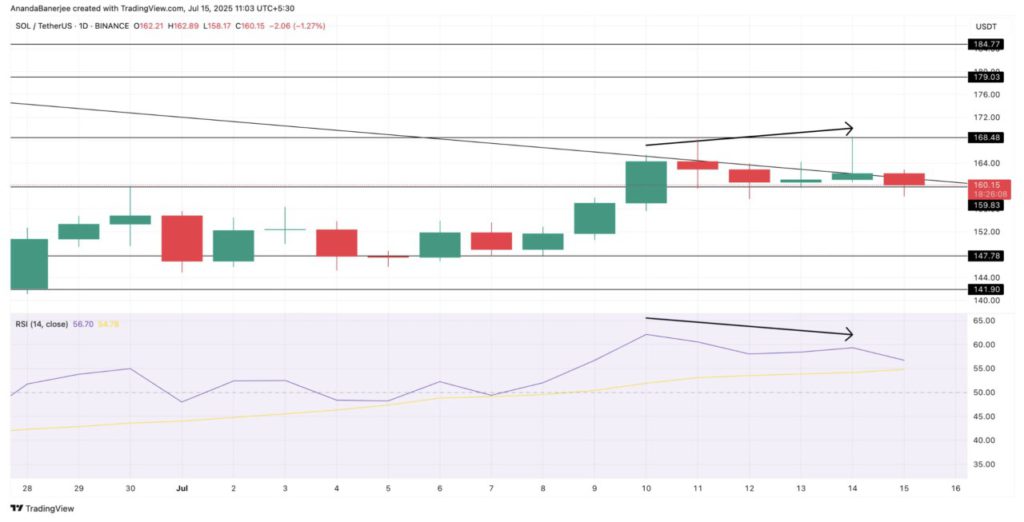
Also, the RSI starts to curve down after approaching its signal line, which further strengthens the case for a temporary cooling.
The RSI (Relative Strength Index) is a momentum indicator that tracks how strong the buying or selling pressure is. Divergence, when prices rise but the RSI falls, usually indicates that momentum is starting to fade.
A bearish divergence on the RSI, if followed by a drop below $158, could invalidate the broader bullish structure.
And a correction to $152 (0.382 Fib level) or lower ($147) could reverse the structure to bearish in the short to medium term.
That’s the latest information about crypto. Follow us on Google News to get the latest information about the world of crypto and blockchain technology. Check today‘ s bitcoin price, today‘ s solana price, pepe coin and other crypto asset prices through Pintu Market.
Enjoy an easy and secure crypto trading experience by downloading Pintu crypto app via Google Play Store or App Store now. Also, get a web trading experience with various advanced trading tools such as pro charting, various types of order types, and portfolio tracker only at Pintu Pro.
*Disclaimer
This content aims to enrich readers’ information. Pintu collects this information from various relevant sources and is not influenced by outside parties. Note that an asset’s past performance does not determine its projected future performance. Crypto trading activities have high risk and volatility, always do your own research and use cold cash before investing. All activities of buying and selling bitcoin and other crypto asset investments are the responsibility of the reader.
Reference:
- BeInCrypto. Solana Price Holds Structure Despite Pullback. Accessed on July 16, 2025