Ethereum Explodes to $3,500 — Is a Massive Run to $4,500 Just Getting Started?

Jakarta, Pintu News – Ethereum remains strong around $3,500, up more than 8% in one day and breaking through a key resistance level.
This comes as data from the on-chain and futures markets suggest that the rally is likely to continue.
Taking a closer look at exchange reserves, funding rates, and price structure, Ethereum has the potential to move up by 32% to $4,541.
Ethereum Price Rises 8.18% in 24 Hours
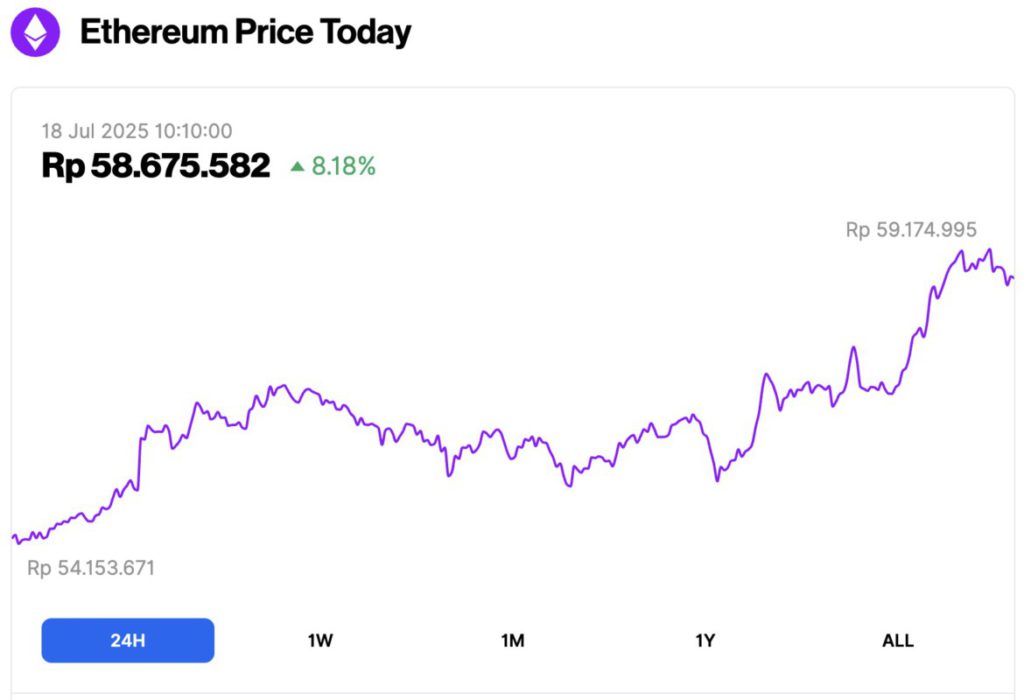
As of July 18, 2025, Ethereum was trading at approximately $3,592, or around IDR 58,675,582 — marking an 8.18% gain over the past 24 hours. Within that time frame, ETH dipped to a low of IDR 54,153,671 and climbed as high as IDR 59,174,995.
At the time of writing, data from CoinMarketCap shows that Ethereum’s market capitalization stands at around $433.68 billion, with daily trading volume rising 11% to $52.65 billion within the last 24 hours.
Read also: Why is XRP Going Up Today (July 18, 2025)?
Exchange Reserves and Netflows Show Similar Pattern to the Great Rally
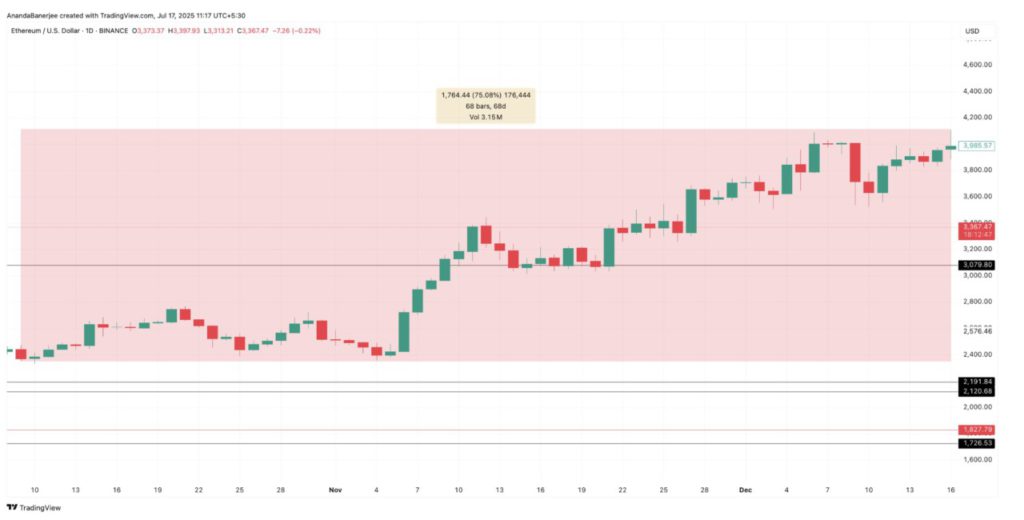
On July 16, Ethereum’s total exchange reserves stood at 19.7 million ETH. This figure is almost the same as that seen on October 9, 2024, just before Ethereum surged 75% in the following two months.
The rally started from a similar reserve base and occurred during a period of consistent outflows.
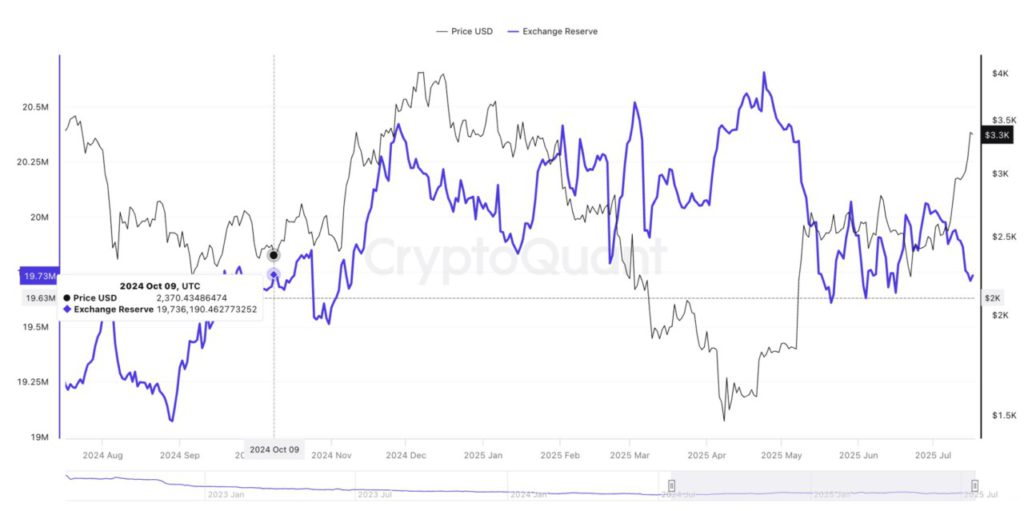
Although similar exchange reserve levels have appeared before, the correlation between July and October makes sense as prices were also on an upward trend at the time.
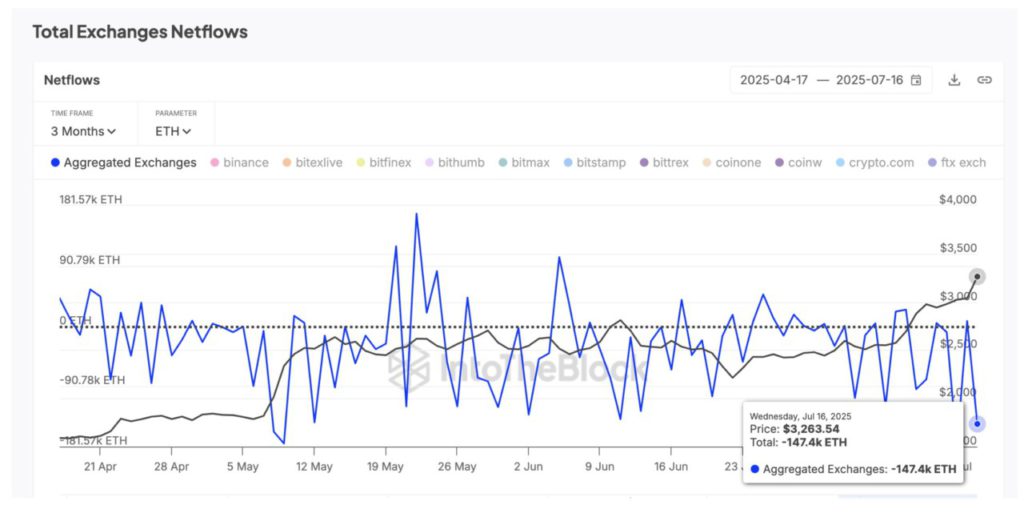
Adding to the similarity of this pattern, aggregated exchange netflows remain negative. On July 16, 147,400 ETH was recorded as net outflows from exchanges. This indicates that more and more users are moving their Ethereum to private or cold wallets, a behavior often associated with the intention to hold, not sell.
The conclusion? Ethereum price is showing signs of being able to absorbprofit-taking while maintaining demand. Supply on exchanges is still tight, which means short-term selling pressure remains low.
Futures Market Rises, but Sentiment Remains Balanced
While the spot market is showing strength through consistent outflows and tight supply, the derivatives market is slowly reflecting the same optimism-but without going overboard.
As of July 17, Ethereum futures trading volume jumped 27.13%, and open interest rose 4.18%. This indicates new positions are being opened, as traders begin to ride the rally.
Read also: Bitcoin Soars to $120,000 — Is the Road to $250K Just Beginning?
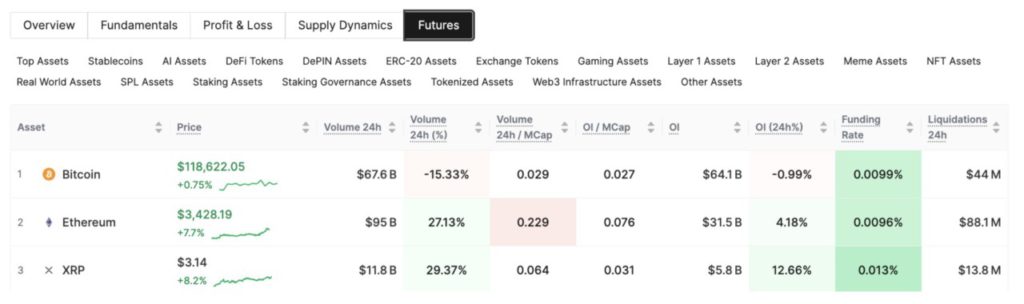
But here’s where it gets interesting: despite the increased exposure, the funding rate remained flat at 0.0096%. This suggests that the market is not heavily skewed towards long positions. The funding rate itself refers to the periodic payments between long and short traders.
When the value remains close to neutral, it indicates that both sides of the market are in balance. Such a pattern makes the rally more sustainable, without the worry of a short or long squeeze.
ETH price breaks key resistance; $4,541 target in sight
Declining reserves on exchanges, ongoing outflows, and neutral funding conditions are starting to reflect directly on Ethereum’s price movements.
ETH has successfully broken through resistance at $3,298, which coincides with the 0.786 Fibonacci extension level. This breakout demonstrates the strength of the spot market and confirms the alignment between on-chain activity and price momentum.
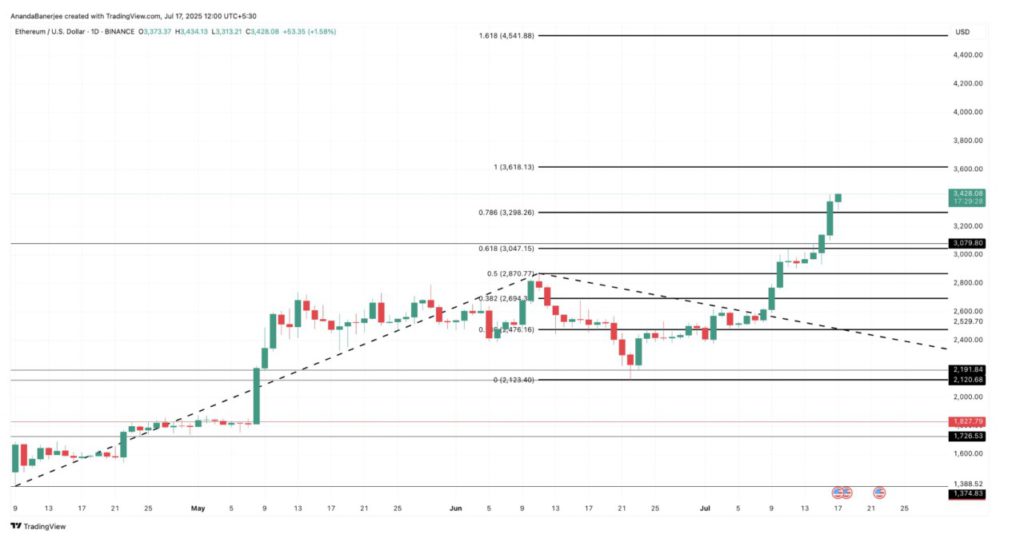
The current trend-based Fibonacci setup started from around the $1,388 level (the low in early April), then rose to the previous swing high around $2,870 and corrected to the next swing low around $2,130. This setup depicts a specific and bullish ETH price increase projection.
The current state of the rally mirrors the situation that occurred in October 2024, when ETH was also at similar reserve levels and subsequently rose by more than 75%. If history repeats itself, the next target for Ethereum will be at $4,541.88-marked by the 1,618 Fibonacci level; potentially providing a 32% upside from current levels.
If that is achieved, even a move towards a 75% increase and a new record high price could be possible.
However, this bullish scenario is only valid if the ETH price stays above $3,047. This level has been a strong support area for the past week.
If the price drops through $2,870-which is the 0.5 Fibonacci level-then this bullish structure will be invalidated. Especially if the decline is accompanied by increased inflows or a reversal of the trend of the stock exchange reserves.
Such a signal could indicate renewed selling pressure and limit the price’s upside potential.
That’s the latest information about crypto. Follow us on Google News to get the latest information about the world of crypto and blockchain technology. Check today‘ s bitcoin price, today‘ s solana price, pepe coin and other crypto asset prices through Pintu Market.
Enjoy an easy and secure crypto trading experience by downloading Pintu crypto app via Google Play Store or App Store now. Also, get a web trading experience with various advanced trading tools such as pro charting, various types of order types, and portfolio tracker only at Pintu Pro.
*Disclaimer
This content aims to enrich readers’ information. Pintu collects this information from various relevant sources and is not influenced by outside parties. Note that an asset’s past performance does not determine its projected future performance. Crypto trading activities have high risk and volatility, always do your own research and use cold cash before investing. All activities of buying and selling bitcoin and other crypto asset investments are the responsibility of the reader.
Reference:
- BeInCrypto. Ethereum Price Eyes $4500 as Exchange Reserves Drop. Accessed on July 18, 2025


