Can Solana Bounce Back? These 3 Key Indicators Suggest It Might
Jakarta, Pintu News – Just a few weeks ago, Solana seemed to be soaring towards the $200 level – but now, that momentum seems to have faded. In the last seven days, Solana’s price has plummeted by almost 10%, putting it under pressure. However, it’s not all doom and gloom.
Despite this decline, Solana still recorded a gain of around 10% in the last three months. In fact, there are three important market signals that are starting to point to a possible recovery.
One of them is a rare technical pattern on the price chart, which has the potential to trigger a short-term rally if successfully confirmed.
Exchange Selling Pressure Drops 10%, Dump Risk Declines?
The first significant change is seen in the number of Solana tokens (SOL) stored on the exchange.
Read also: Can Bitcoin (BTC) Reach $200K by the End of 2025? Check out 4 Important Signs!
From 33.06 million SOL on July 23, the figure dropped sharply to 30.78 million SOL as of August 5 – a drop of almost 10%. This means that there are fewer and fewer tokens available on the exchange, a classic signal that selling pressure is starting to ease.
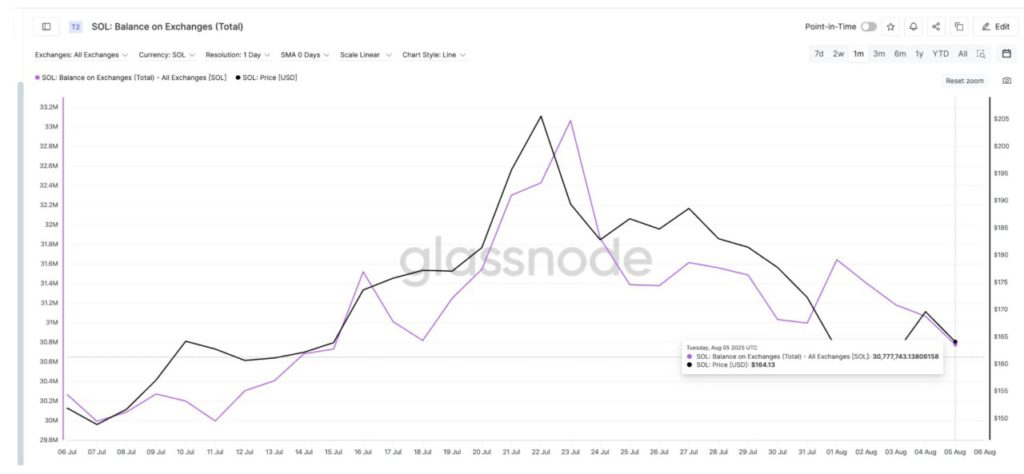
More interestingly, there has been a bullish crossover on the same chart: the Solana price is again moving above the supply trend line on the exchange.
Historically, whenever this pattern appears, Solana often experiences short-term rallies. For example, on July 16, when SOL prices broke through this supply line, prices jumped from $173 to $205 in just six days.
A similar move occurred on July 24, with a rise from $182 to $188 in three sessions. The same crossover was also seen at $169 – although the price corrected afterwards, this pattern is still worth watching.
Institutional Futures Remain Stable Despite Falling Prices – A Sign of Hidden Strength?
The second signal of strength came from the institutional derivatives market. Solana’s open interest (active futures contracts) data on the CME (Chicago Mercantile Exchange) remained stable despite the spot price decline – creating a bullish divergence of sorts.
For example, on August 1, open interest on CME was steady at 3.07 million, while SOL prices fell from $162 to $158. However, shortly after, the price quickly rose back up to $169 as the gap began to narrow.
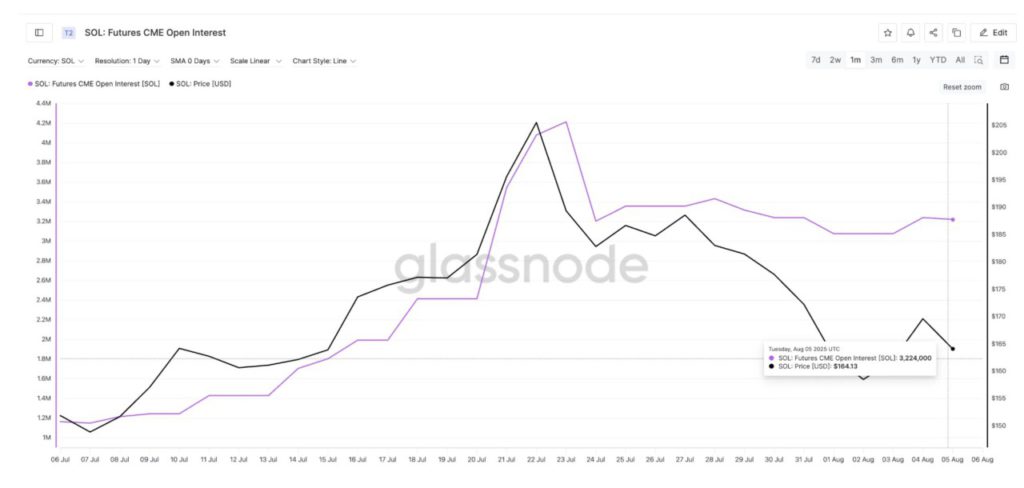
A similar pattern also occurred on July 25-27. At that time, the open interest on the CME did not change, even though the SOL price fell. But when sentiment started to improve, Solana prices rose again from $184 to $188.
Read also: Ripple Drops Below $3 — Analyst Warns XRP Could Fall Even Further
Why is the CME important? Because this is where institutional investors play. When open interest remains strong amid falling prices, it’s often a signal that long-term buyers are still holding out – waiting for weak traders to exit before they re-enter.
Solana’s Daily Chart Hints at a Golden Crossover – A Sign of a New Rally?
The last – and perhaps most interesting signal for traders – comes from the daily chart of Solana prices. As of August 6, the 100-day EMA line (light blue color) started approaching the 200-day EMA (dark blue) from below.
If it manages to break to the upside, it will form a pattern known as a golden crossover – a technical formation that is often considered the start of a stronger upward trend. In fact, it can sometimes trigger massive rallies.
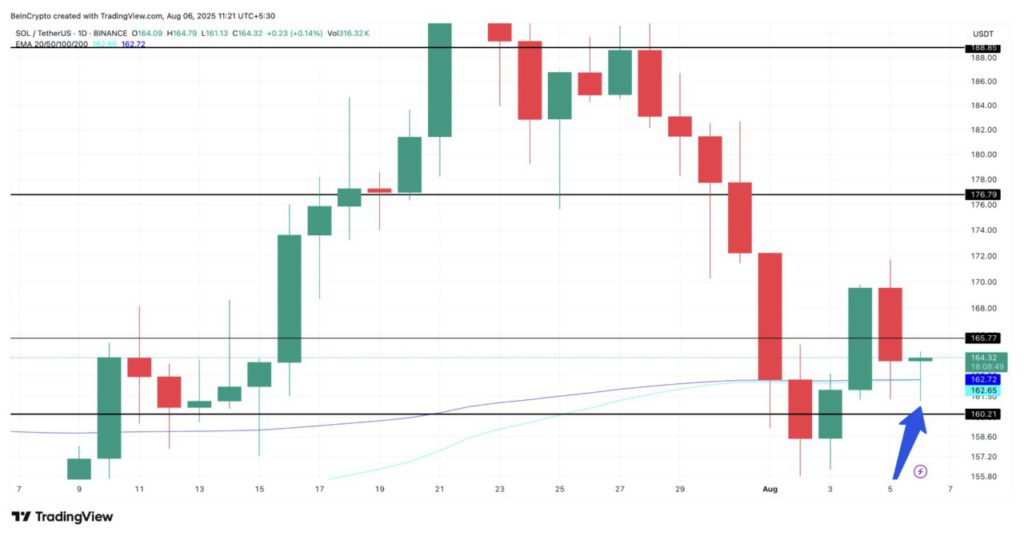
Currently, the SOL price is still holding above the $160 support level. If this level can be maintained and the price manages to break $176 again (about 10% higher than the current position), then the short-term trend could turn bullish.
If Solana is able to break $188, the $200 target is again open. However, if the $155 support is broken, the risk of further decline begins to grow.
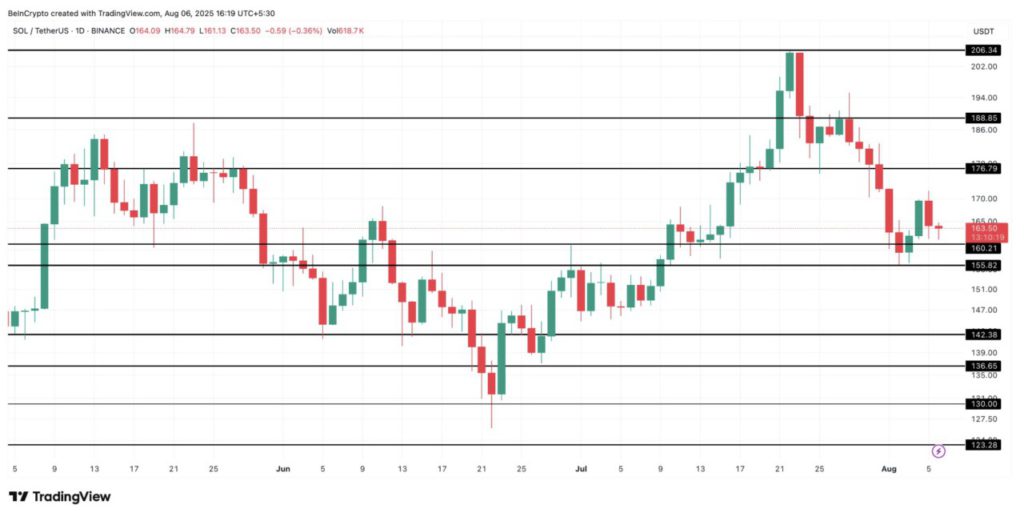
The technical signal is completely nullified if SOL drops below $142. This could happen if the two approaching EMA lines reverse direction and form a death crossover pattern – where the 200-day EMA breaks above the 100-day EMA, signaling a potential deeper downtrend.
That’s the latest information about crypto. Follow us on Google News to get the latest information about the world of crypto and blockchain technology. Check today‘ s bitcoin price, today’s solana price, pepe coin and other crypto asset prices through Pintu Market.
Enjoy an easy and secure crypto trading experience by downloading Pintu crypto app via Google Play Store or App Store now. Also, get a web trading experience with various advanced trading tools such as pro charting, various types of order types, and portfolio tracker only at Pintu Pro.
*Disclaimer
This content aims to enrich readers’ information. Pintu collects this information from various relevant sources and is not influenced by outside parties. Note that an asset’s past performance does not determine its projected future performance. Crypto trading activities have high risk and volatility, always do your own research and use cold cash before investing. All activities of buying and selling bitcoin and other crypto asset investments are the responsibility of the reader.
Reference:
- BeInCrypto. Solana Price Rebound: Three Key Metrics. Accessed on August 7, 2025


