Three Key Pi Network Signals Emerge — Could Pi Coin Be Ready to Surge?

Jakarta, Pintu News – As reported by BeInCrypto (11/8/25), the price of Pi Coin has been boosted by the broader market rally, recording a gain of nearly 15% in the last seven days-a pace that traders haven’t seen in over a month.
Early August showed signs of strength, and now three major technical indicators are all pointing to bullish signals.
When multiple signals combine, the chances of a strong move occurring increase-but that only happens if there is a continuation of momentum.
Rising ADX Shows Pi Coin Trend is Getting Stronger
The Average Directional Index (ADX) measures the strength of a trend, rather than determining whether the trend is bullish or bearish. A low ADX reading indicates the market is sluggish, while a rising reading indicates momentum is building.
Read also: Pi Network Price Drops 6% Today (August 12) Amid Uncertainty Over Binance Listing
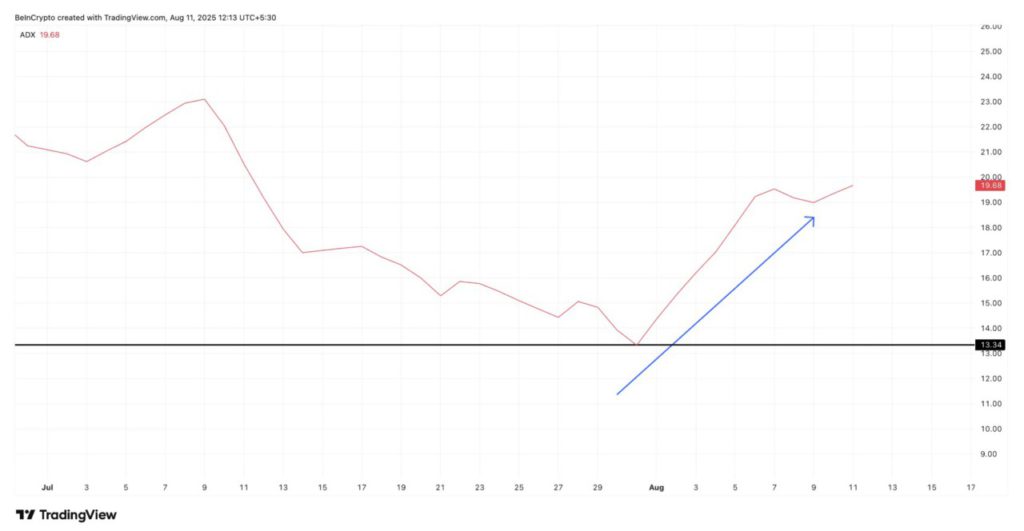
For the Pi Coin price, the ADX was around 13.3 on July 31, which is considered a weak trend. Currently, the value has jumped to 19.6, indicating the upward trend is starting to gain a stronger foothold.
A strengthening ADX amidst an upward price trend means that buyers are getting more aggressive, and the market is allocating more volume to this movement. This makes testing the next resistance level for Pi Coin more significant.
Bullish Divergence on Daily RSI Signals Buyers Quietly Increase Pressure
The Relative Strength Index (RSI) measures whether an asset is overbought or oversold by monitoring the speed and magnitude of price changes.
A bullish divergence occurs when the price prints lower highs but the RSI prints higher highs instead, signaling increased buying pressure despite the lagging price.
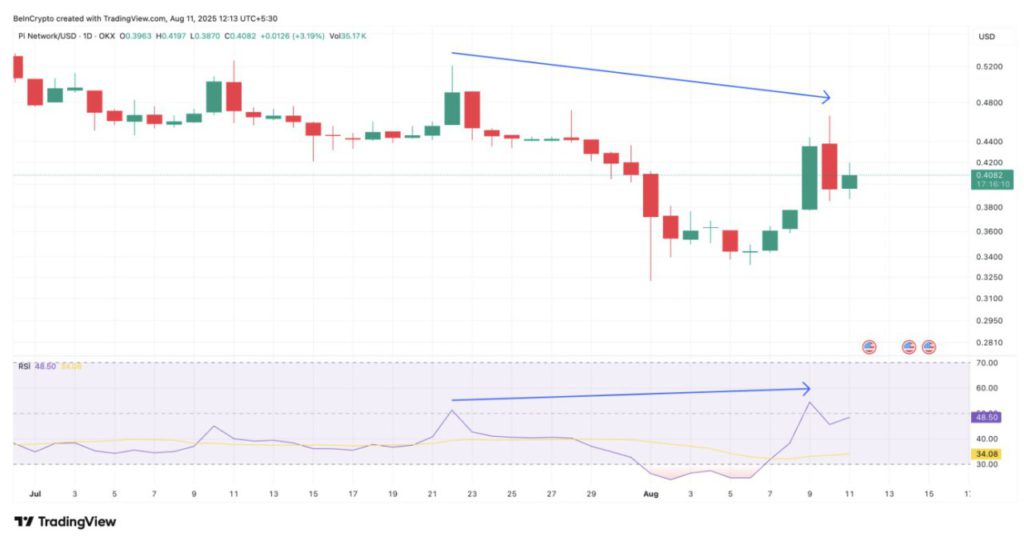
On Pi Coin, on July 22, the price was around $0.52 with the RSI at 51. But on August 10, the price dropped to $0.46, while the RSI rose to 54. This discrepancy indicates sellers are starting to lose control, and buyers are slowly taking over.
Read also: Can Pi Network Price Recover? Here’s the Strategy from Community Members
The combination of a rising ADX and bullish divergence on the RSI suggests the uptrend is not only getting stronger, but also supported by improving momentum behind the scenes.
4 Hour Chart Shows Pi Coin Remains in a Bullish Structure
On the 4-hour chart, Pi Coin is holding inside an ascending triangle pattern, a bullish continuation pattern, which is our second bullish indicator.
PI prices remain above the 20-period Exponential Moving Average (EMA) (red line) and 100-period EMA (light blue), signaling the strength of the short- and medium-term trend.
But that’s not the only signal. A bullish golden crossover is about to happen, with the 20-period EMA line approaching the 100-period EMA line. These lines are already touching, and it’s just a matter of waiting for the full crossover to happen.
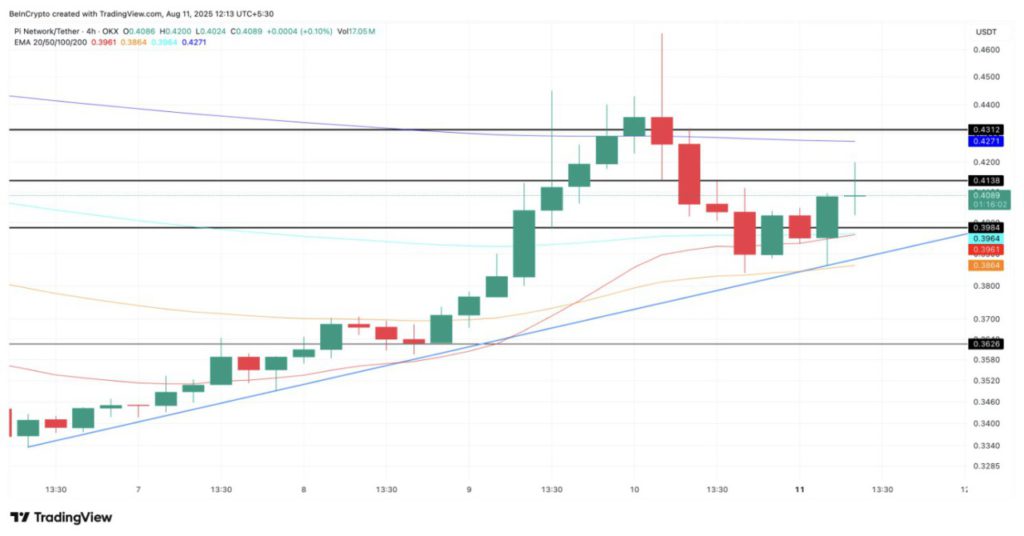
The key elements of the chart to look out for after the crossover occurs:
- Breakout to the upside: A rise above $0.41 and $0.43 could open the door for a sharper rally.
- Support: $0.39 is the first strong support floor, followed by the 20 EMA and 100 EMA.
- Bearish reversal: The new structure turns short-term bearish if the price drops below $0.38 (EMA 50).
If the ADX continues to rise and the RSI maintains its bullish divergence, the chances of a breakout from this pattern will grow, potentially triggering the “one big spike” that traders are anticipating. However, a drop below $0.38 would invalidate this bullish outlook.
That’s the latest information about crypto. Follow us on Google News to get the latest information about the world of crypto and blockchain technology. Check today‘ s bitcoin price, today’s solana price, pepe coin and other crypto asset prices through Pintu Market.
Enjoy an easy and secure crypto trading experience by downloading Pintu crypto app via Google Play Store or App Store now. Also, get a web trading experience with various advanced trading tools such as pro charting, various types of order types, and portfolio tracker only at Pintu Pro.
*Disclaimer
This content aims to enrich readers’ information. Pintu collects this information from various relevant sources and is not influenced by outside parties. Note that an asset’s past performance does not determine its projected future performance. Crypto trading activities have high risk and volatility, always do your own research and use cold cash before investing. All activities of buying and selling bitcoin and other crypto asset investments are the responsibility of the reader.
Reference:
- BeInCrypto. Pi Price Rally: Three Bullish Signals. Accessed on August 12, 2025