Ethereum Plunges to $4,200 Today: Is the $5,000 Milestone Slipping Away?

Jakarta, Pintu News – The flagship altcoin, Ethereum , is showing a downward trend since its attempt to return to its all-time high price on August 13 failed.
The selling pressure intensified as profit-taking increased, resulting in the ETH price dropping about 10% in the last five days and is expected to continue to decline.
Ethereum Price Drops 1.43% in 24 Hours
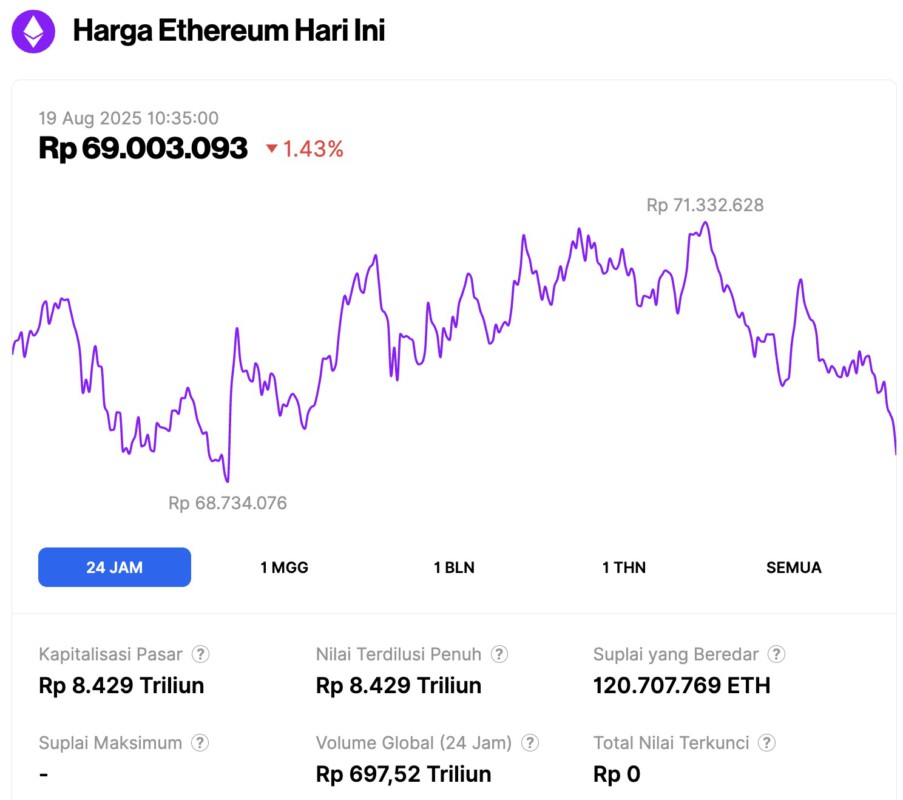
On August 19, 2025, Ethereum traded at approximately $4,236 (around IDR 69,003,093), marking a 1.43% correction over the past 24 hours. During this period, ETH reached a low of IDR 68,734,076 and a high of IDR 71,332,628.
As of now, Ethereum’s market capitalization stands at roughly IDR 8,429 trillion, while its daily trading volume surged 11% to IDR 697.52 trillion over the past day.
Read also: Bitcoin Holds Around $115K on August 19: Is Further Decline on the Horizon?
Ethereum Bears Take Over
ETH’s long/short ratio has dropped to a 30-day low, reflecting increased trader caution and declining bullish sentiment. Currently, the ratio stands at 0.90.
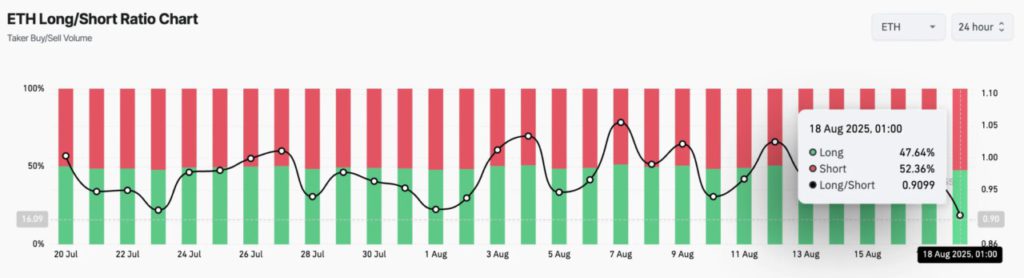
The long/short ratio compares the number of long and short positions in the market. When the ratio is above 1, it means that there are more long positions than shorts, indicating that the majority of traders expect prices to rise.
Conversely, a ratio below 1, as is the case with ETH, indicates most traders are positioning for a price drop, signaling an increasingly strong bearish sentiment among ETH futures contract holders.
Also, the negative crossover on ETH’s MACD indicator during today’s session shows the sellers’ increasing dominance again. Currently, the MACD line (blue) is below the signal line (orange).
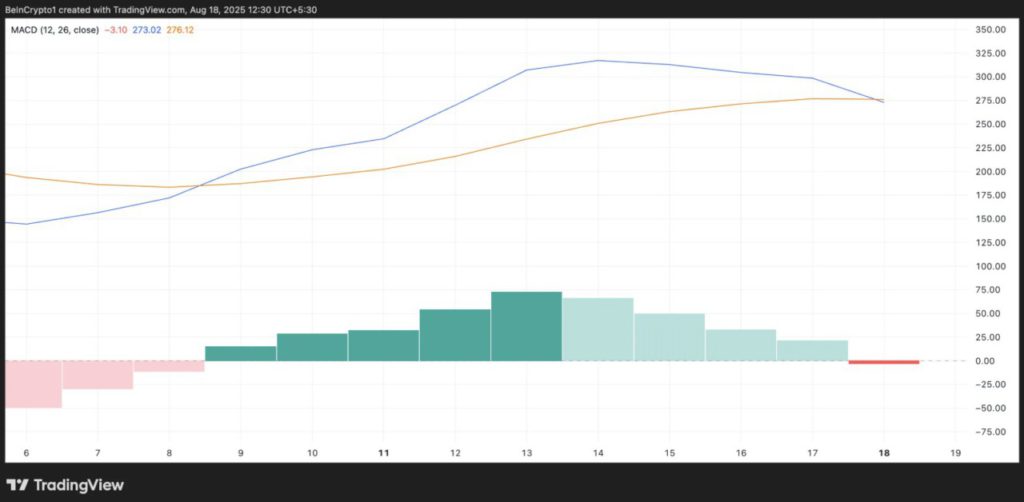
The MACD indicator helps identify the trend and momentum of price movements. The crossover between the MACD line and the signal line is used by traders to read buy or sell signals.
When the MACD line declines below the signal line, it’s considered a bearish signal, signaling downward momentum is increasing and sellers are starting to take control of the market.
Read also: Binance Listing Falls Through — But This Analyst Explains Why Pi Network’s Price Could Rebound
ETH’s latest MACD negative crossover reinforces the possibility of continued selling pressure, increasing the risk of a price drop towards the immediate support level around $4,000.
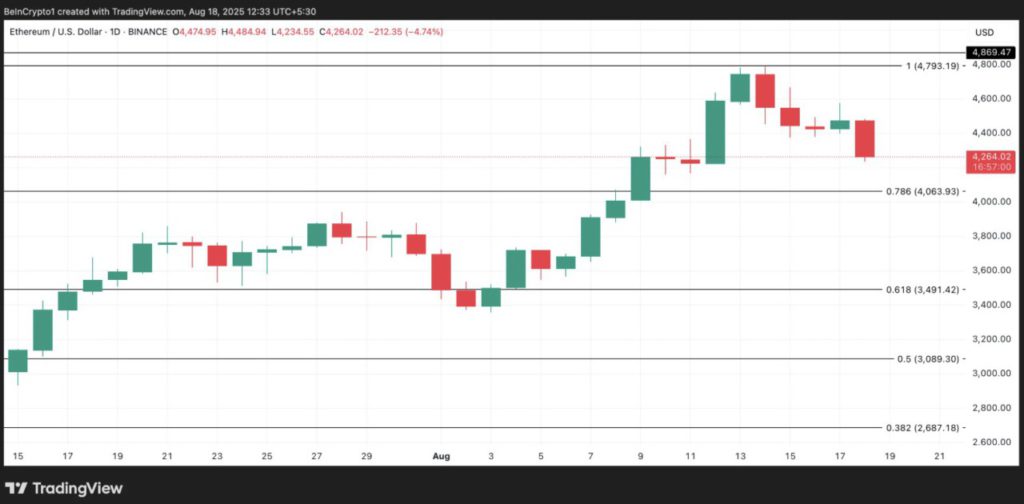
ETH price faces critical test
On August 18, ETH was trading at $4,224. If the selling pressure continues, the major altcoin is at risk of dropping towards $4,063. If this support level fails to hold, ETH prices could fall further to $3,491.
On the other hand, if there is a new influx of demand into the market, ETH prices could potentially rise up to $4,793. A successful break above this level could trigger a rally back towards ETH’s all-time high of $4,869.
That’s the latest information about crypto. Follow us on Google News to get the latest information about the world of crypto and blockchain technology. Check today‘ s bitcoin price, today’s solana price, pepe coin and other crypto asset prices through Pintu Market.
Enjoy an easy and secure crypto trading experience by downloading Pintu crypto app via Google Play Store or App Store now. Also, get a web trading experience with various advanced trading tools such as pro charting, various types of order types, and portfolio tracker only at Pintu Pro.
*Disclaimer
This content aims to enrich readers’ information. Pintu collects this information from various relevant sources and is not influenced by outside parties. Note that an asset’s past performance does not determine its projected future performance. Crypto trading activities have high risk and volatility, always do your own research and use cold cash before investing. All activities of buying and selling bitcoin and other crypto asset investments are the responsibility of the reader.
Reference:
- BeInCrypto. ETH Price Fails to Reclaim $5000. Accessed on August 19, 2025


