BTC vs. ETH: What is the price movement today (8/22/25)?

Jakarta, Pintu News – The price movements of the two largest crypto assets, Bitcoin and Ethereum , on August 22, 2025, show interesting dynamics.
BTC briefly weakened to the $112,500 area before stabilizing around $113,000, while ETH was depressed to the $4,200 level but managed to recover to around $4,290.
This difference in pattern suggests that while both are still facing market pressure, Ethereum looks to rebound faster than Bitcoin.
Check out the full analysis here!
Bitcoin (BTC) price drops 0.69% in 24 hours
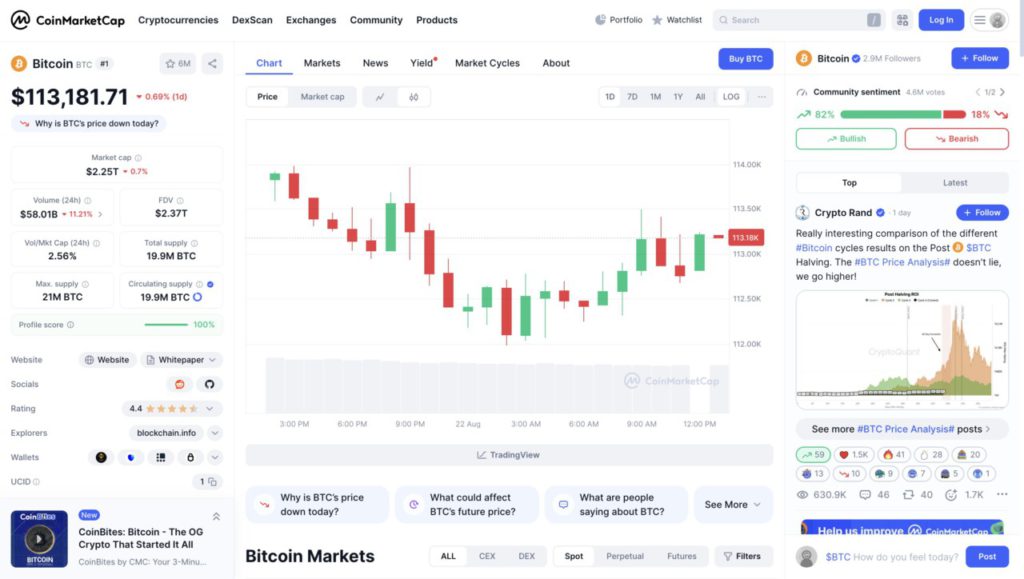
Bitcoin’s (BTC) daily price chart shows a sideways movement with slight selling pressure. Currently, the price of BTC is around $113,181.71, down 0.69% in the last 24 hours.
From the candlestick chart, it can be seen that in the afternoon to evening period of August 21, the price had weakened with the dominance of red candles. However, entering the early morning of August 22, several green candles appeared, signaling an attempt to rebound. Even so, this increase is not strong enough to bring BTC back to the $114,000 level, so the movement is still limited to the range of $112,500 – $113,500.
In terms of market fundamentals:
- BTC’s market cap currently stands at $2.25 trillion, down 0.7%.
- The 24-hour trading volume was recorded at $58.01 billion, a significant drop of 11.21%.
- The Volume/Market Cap ratio stood at 2.56%, indicating moderately active trading activity despite the decline.
- The amount of BTC in circulation has almost reached the maximum supply, which is 19.9 million out of 21 million BTC.
Interestingly, despite the slight price correction, community sentiment is still very positive with 82% of investors expressing bullishness out of over 4.6 million votes. This shows that in the long term, many market participants are still optimistic on BTC’s prospects, especially regarding the ongoing post-halving cycle.
Read also: OKB Price Soars 152.71% in 7 Days, What’s the Upside Factor?
Ethereum (ETH) Price Drops 0.56% in 24 Hours
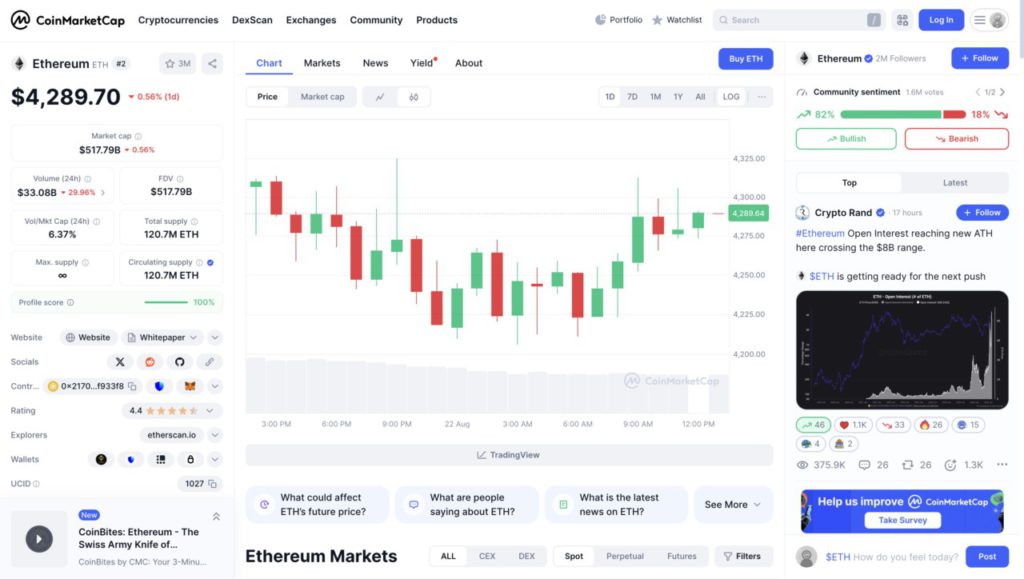
Ethereum’s (ETH) daily chart shows a sideways movement with slight selling pressure. The current price of ETH is around $4,289.70, a slight decrease of 0.56% in the last 24 hours.
From the candlestick chart, it can be seen that there are quite active price fluctuations. During the night to early morning of August 22, ETH had weakened with the dominance of red candles that pressed the price near the $4,200 area. However, from morning to noon, several green candles appeared indicating a price recovery, so ETH moved back to the $4,280-$4,300 area.
Fundamental data shows:
- Ethereum’s market cap stands at $517.79 billion, down 0.56%.
- The 24-hour trading volume was $33.08 billion, a sharp decline of 29.96%, signaling reduced trading activity.
- The amount of ETH in circulation currently stands at 120.7 million ETH, with no maximum supply limit.
Interestingly, despite the slight correction in price, community sentiment is still very optimistic, with 82% of investors expressing bullishness out of 1.6 million votes. In fact, according to market analysts, Ethereum’s Open Interest has touched a new record high above $8 billion, signaling that ETH is potentially gearing up for its next upward push.
Conclusion
Overall, the price movements of Bitcoin (BTC) and Ethereum (ETH) in the last 24 hours show different yet complementary dynamics, where BTC tends to weaken before attempting stabilization, while ETH manages to show recovery towards the nearby resistance area.
Despite both experiencing selling pressure, high community optimism and certain technical indicators signal that the two largest cryptocurrencies still hold the potential for strengthening in the next period, especially if market momentum returns after the decline in trading volume.
That’s the latest information about crypto. Follow us on Google News to get the latest information about the world of crypto and blockchain technology. Check today‘ s bitcoin price, today’s solana price, pepe coin and other crypto asset prices through Pintu Market.
Enjoy an easy and secure crypto trading experience by downloading Pintu crypto app via Google Play Store or App Store now. Also, get a web trading experience with various advanced trading tools such as pro charting, various types of order types, and portfolio tracker only at Pintu Pro.
*Disclaimer
This content aims to enrich readers’ information. Pintu collects this information from various relevant sources and is not influenced by outside parties. Note that an asset’s past performance does not determine its projected future performance. Crypto trading activities have high risk and volatility, always do your own research and use cold cash before investing. All activities of buying and selling bitcoin and other crypto asset investments are the responsibility of the reader.
Reference:
- Coinmarketcap
- Featured Image: Crypto Economy


