Bitcoin Price Warning: Is a Big Drop Coming in September 2025?

Jakarta, Pintu News – Bitcoin is showing bearish signs below $112,000. Currently, Bitcoin (BTC) is struggling to recover and may see further declines below the $108,000 zone.
Current Bitcoin Market Conditions
Bitcoin (BTC) recently attempted a recovery wave from the $107,352 low. The cryptocurrency managed to rise above the $108,000 and $108,500 resistance levels. Despite crossing the 23.6% Fibonacci retracement level of the notable decline from the $113,457 high to $107,352 low, the bears remain active near $109,500 and are blocking further gains.
Currently, the price has dropped below $109,000 again. There is a breakdown below the bullish trend line with support at $108,450 on the hourly chart of the BTC/USD pair. Bitcoin (BTC) is now trading below $109,000 and the 100 hourly simple moving average.
Also Read: Can Ripple (XRP) Make Investors Millionaires? Here Are the Prospects According to Analysts!
Key Resistance and Support
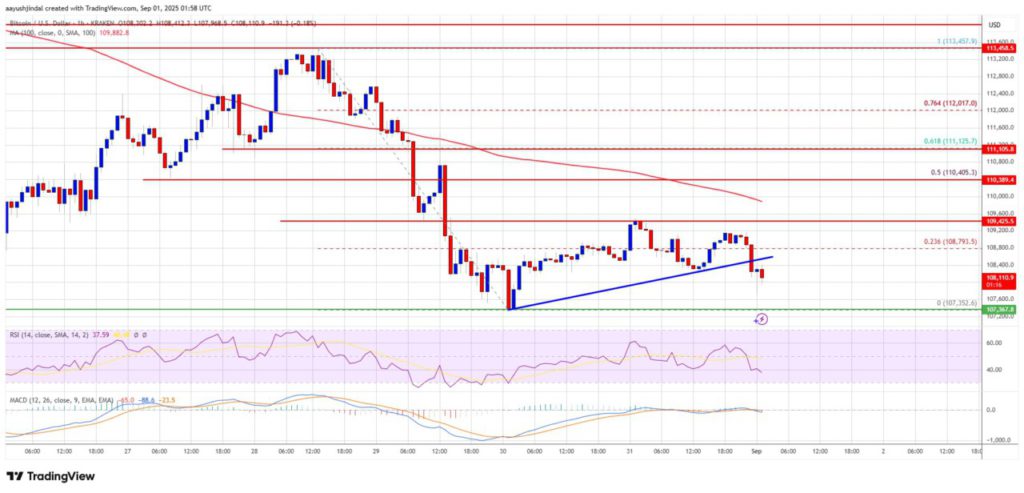
Immediate resistance on the upside is near the $109,400 level. The first key resistance is near the $110,000 level. The next resistance could be $110,500 or the 50% Fibonacci retracement level of the key drop from $113,457 to $107,352.
A close above the $110,500 resistance might push the price even higher. In that case, the price could rise and test the $112,000 resistance level. A further increase would probably direct the price towards $112,500, with the primary target being $113,500.
Potential Bitcoin Price Decline
If Bitcoin (BTC) fails to rise above the $110,500 resistance zone, the currency could start a new decline. Immediate support is near the $108,000 level. The first major support is near the $107,400 level.
The next support is now near the $106,500 zone. Further losses will probably send the price towards the $105,500 support in the short term. The key support is at $103,500, below which Bitcoin (BTC) may experience a sharp decline.
Conclusion: The Future of Bitcoin Price
Technical indicators show that the hourly MACD is now firming up in the bearish zone. Meanwhile, the hourly Relative Strength Index (RSI) for BTC/USD is now below the 50 level. With key support at $107,400, followed by $106,500, and key resistance at $109,500 and $110,500, investors and traders should be on the lookout for further Bitcoin (BTC) price movements.
Also Read: 4 Interesting Facts Why 1 in 4 Brits are Interested in Crypto Investment for Retirement Funds
Follow us on Google News to get the latest information about the world of crypto and blockchain technology. Check today‘ s bitcoin price, today’s solana price, pepe coin and other crypto asset prices through Pintu Market.
Enjoy an easy and secure crypto trading experience by downloading Pintu crypto app via Google Play Store or App Store now. Also, get a web trading experience with various advanced trading tools such as pro charting, various types of order types, and portfolio tracker only at Pintu Pro.
*Disclaimer
This content aims to enrich readers’ information. Pintu collects this information from various relevant sources and is not influenced by outside parties. Note that an asset’s past performance does not determine its projected future performance. Crypto trading activities are subject to high risk and volatility, always do your own research and use cold hard cash before investing. All activities of buying andselling Bitcoin and other crypto asset investments are the responsibility of the reader.
Reference
- NewsBTC. Bitcoin Price Warning: $110K. Accessed on September 1, 2025