9 Important Things About Relative Strength Index (RSI) that Traders Must Understand

Jakarta, Pintu News – RSI is one of the most popular technical indicators for measuring price momentum. By understanding the key numbers (30, 50, 70), traders can recognize buy/sell signals and potential price reversals. However, its use needs to be tailored to the trend and combined with other indicators to avoid false signals.
1. What is Relative Strength Index (RSI)?
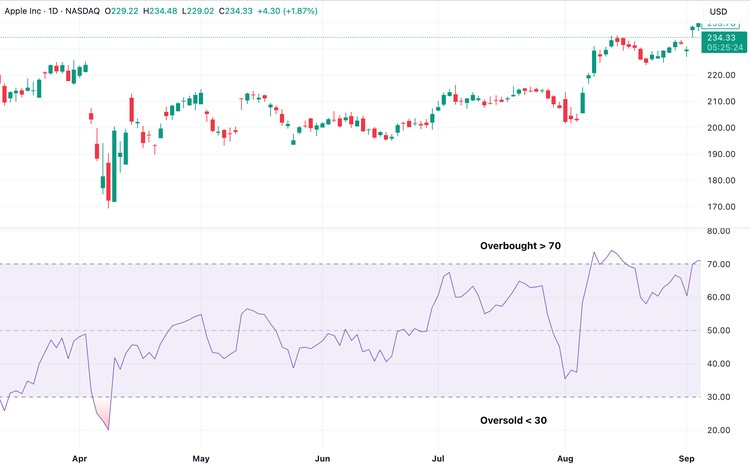
According to Investopedia (Jason Fernando, 2025), the Relative Strength Index (RSI) is a momentum indicator used in technical analysis to measure the speed and magnitude of price changes. The RSI is displayed as an oscillator chart with a scale of 0-100.
Typically, a reading above 70 indicates an overbought condition, while below 30 indicates oversold. The RSI was developed by J. Welles Wilder Jr. in his 1978 book New Concepts in Technical Trading Systems.
Also Read: 5 Shocking Facts About AVAX: Up 10.52% in 24 Hours, Price Breaks IDR 583,000!
2. How Does RSI Work?
RSI compares the average price increase to the average price decrease over a certain period (default 14 days). The greater the increase compared to the decrease, the higher the RSI value, and vice versa.
As such, the RSI helps traders assess whether an asset has the potential for a reversal or just a temporary correction.
3. RSI Calculation Formula
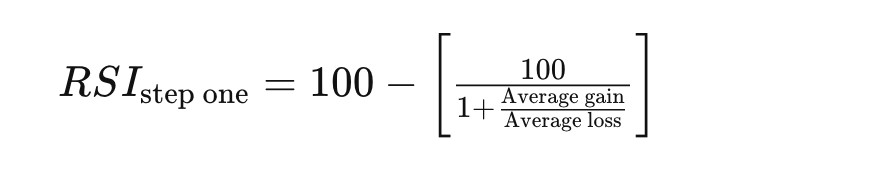
The RSI calculation consists of two stages:
- Initial stage: calculate the average gain and loss over 14 periods.
- Second stage: smoothing so that the RSI value is not extreme except in a strong trend.
The basic formula is: RSI=100-1001+AverageGainAverageLossRSI=100 – \frac{100}{1+\frac{Average Gain}{Average Loss}}RSI=100-1+AverageLossAverageGain100
Example: if you average 1% gain and 0.8% loss for 14 days, the initial RSI will be around 55.55.
4. Why is RSI Important?
According to Investopedia, RSI helps traders:
- Identifying overbought/oversold.
- Signaling a potential reversal.
- Confirms the ongoing trend.
- Determines entry/exit points for short-term traders.
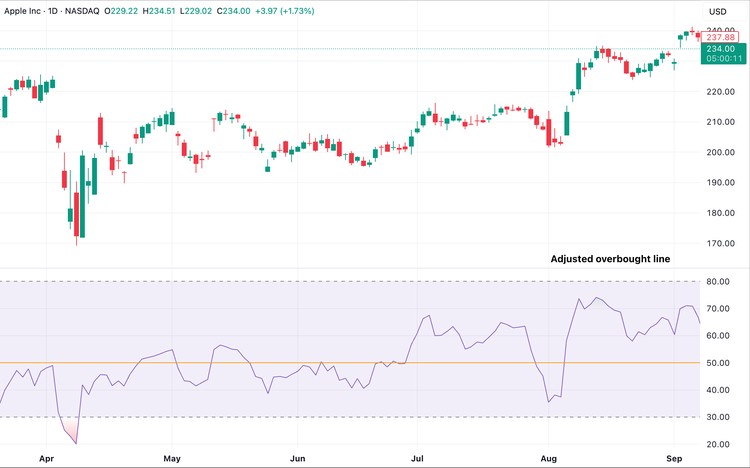
However, the RSI is most effective in sideways (ranging) markets, not when the trend is very strong.
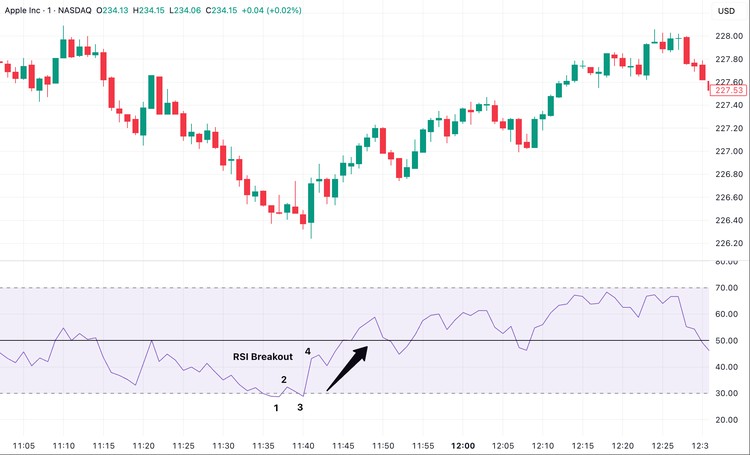
5. Bullish and Bearish RSI Numbers
- Bullish: RSI falls below 30 and then rises again, or RSI spikes in the 40-50 area during an uptrend.
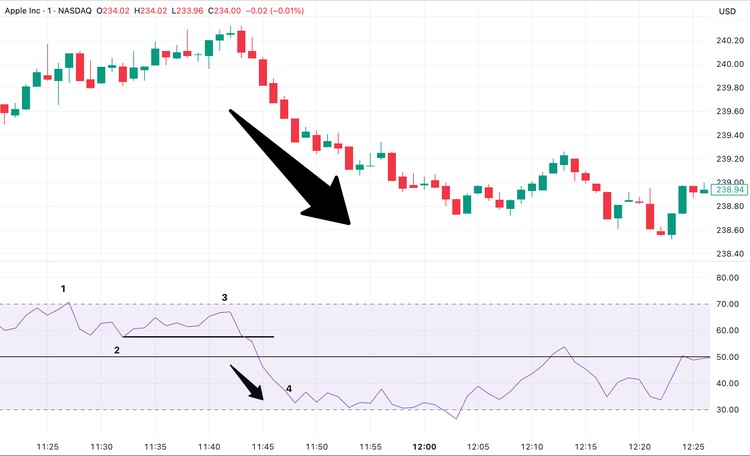
- Bearish: RSI rises above 70 and then falls back, or RSI fails to cross 50-60 in the middle of a downtrend.
This signal is stronger when it is in line with the main trend.
6. RSI Divergence
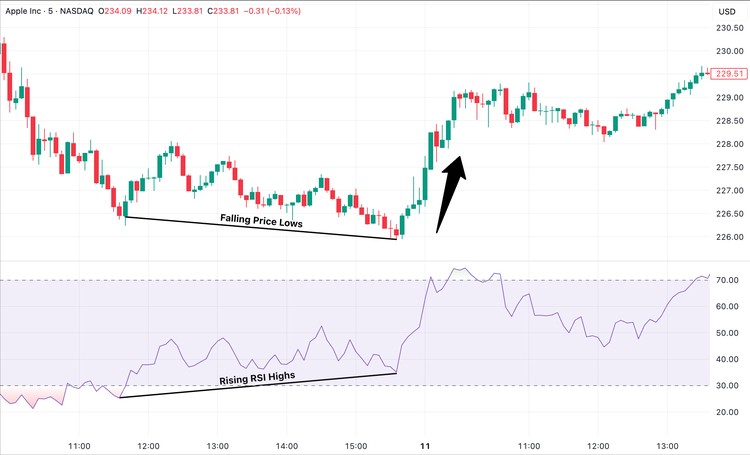
Divergence occurs when the price movement and the RSI are not in the same direction:
- Bullish divergence: price makes lower low, RSI makes higher low → indication of bullish momentum.
- Bearish divergence: price makes higher high, RSI makes lower high → indication of potential weakness.
Although often used, divergences can give false signals if the trend is still very strong.
7. Swing Rejection RSI
Another technique is swing rejection, which is when the RSI exits the overbought/oversold zone and then fails to return.
- Bullish swing rejection: RSI drops below 30, rises again, then fails to break 30 again → buy signal.
- Bearish swing rejection: RSI rises above 70, falls again, then fails to break 70 again → sell signal.
8. RSI vs. MACD
Both RSI and MACD (Moving Average Convergence Divergence) are momentum indicators, but they work differently.
- RSI: measures the magnitude of the price increase/decrease within a certain period.
- MACD: compares two EMAs (exponential moving averages), usually periods 12 and 26.
They can be used together for a more complete technical picture.
9. Limitations of RSI
- Can give false signals in strong trends.
- The RSI can remain in the overbought/oversold zone for a long time.
- Most effective in range-bound (sideways) markets.
Therefore, RSI should be combined with other indicators such as moving averages, support-resistance, or volume analysis.
Also Read: 5 Facts on Hedera (HBAR) Price Pressure: Can it Survive Above IDR3,940?
Follow us on Google News to get the latest information about the world of crypto and blockchain technology. Check today‘ s bitcoin price, today’s solana price, pepe coin and other crypto asset prices through Pintu Market.
Enjoy an easy and secure crypto trading experience by downloading Pintu crypto app via Google Play Store or App Store now. Also, get a web trading experience with various advanced trading tools such as pro charting, various types of order types, and portfolio tracker only at Pintu Pro.
*Disclaimer
This content aims to enrich readers’ information. Pintu collects this information from various relevant sources and is not influenced by outside parties. Note that an asset’s past performance does not determine its projected future performance. Crypto trading activities are subject to high risk and volatility, always do your own research and use cold hard cash before investing. All activities of buying andselling Bitcoin and other crypto asset investments are the responsibility of the reader.
Reference
- Jason Fernando / Investopedia. Relative Strength Index (RSI): What It Is, How It Works, and Formula. Accessed September 24, 2025.