3 Crypto Price Predictions: Is Weakening BTC, ETH & XRP Momentum Pointing to a Deeper Correction?

Jakarta, Pintu News – Bitcoin , Ethereum , and Ripple stabilized on Wednesday (24/9) after falling around 3%, 6%, and 5% respectively throughout the week.
According to FX Street’s report, the top three cryptocurrencies are still showing signs of weakness, with reduced momentum signaling a potential deeper correction in the future.
Bitcoin Has the Potential to Correct Further
Bitcoin price failed to hold at the $116,000 daily support level last Friday and fell 3.19% in the following four days, to close below the 50-day Exponential Moving Average (EMA) at $113,794. On Wednesday (Sep 24), BTC was moving around $112,157.
Read also: Crypto Whales Reel as Panic Selling Leads to Heavy Losses in September’s Market Turmoil
If this correction continues, the decline could widen to retest the next daily support at $107,245.
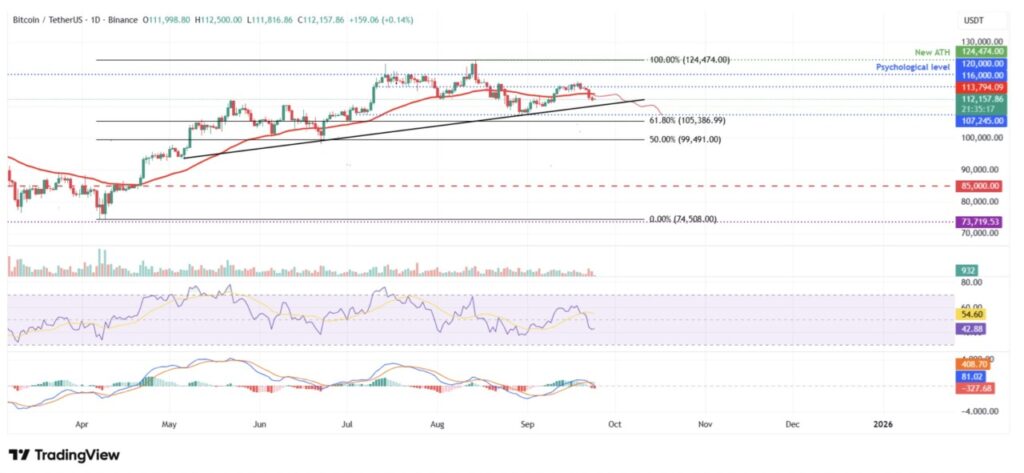
The Relative Strength Index (RSI) on the daily chart is at 42, below the neutral point of 50, signaling strong bearish momentum. The Moving Average Convergence Divergence (MACD) indicator also showed a bearish crossover on Monday, giving a sell signal.
Also, the red histogram getting higher below the neutral level also indicates a continued downtrend.
However, if BTC is able to recover and close the trade above the 50-day EMA at $113,794, there is a chance of further recovery towards the daily resistance at $116,000.
Bearish Mastering Ethereum’s Momentum
Ethereum price closed below the daily support level of $4,488 last Friday and fell 6.77% in the following four days, until finally closing below the next daily support at $4,232 on Tuesday. At the time of writing on Wednesday, ETH was hovering around $4,171.
If the downward trend continues, ETH could potentially weaken further to retest the 61.8% Fibonacci retracement level of $3,593.
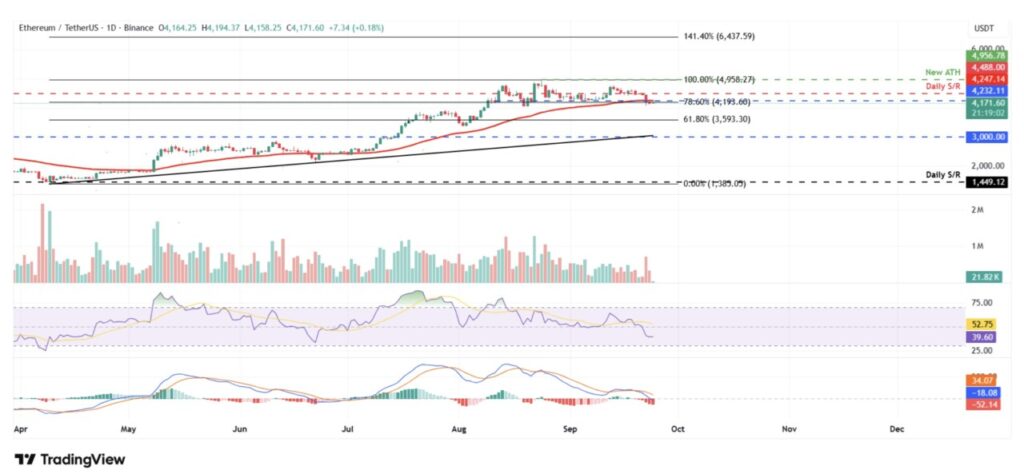
As with Bitcoin, Ethereum’s RSI and MACD indicators also favor a bearish view, indicating a continuation of the downward trend. On the contrary, if ETH is able to recover and close trading above the $4,232 daily resistance, the recovery could continue towards the next daily resistance at $4,488.
XRP Bearish Pressure Grows Stronger
Ripple (XRP) failed to hold around the 61.8% Fibonacci retracement level of $2.99 last Friday and fell 6.62% through Tuesday (23/9). On Wednesday (24/9), XRP was moving around $2.82.
Read also: XRP Price Forecast: Analyst Says the Token Is Entering the Early Stages of a Sudden Breakout
If the correction continues and XRP closes below the daily support of $2.72, the decline could widen to retest the next daily support at $2.35. Like Bitcoin and Ethereum, XRP’s momentum indicator also supports a bearish view, which hints at a possible deeper correction ahead.
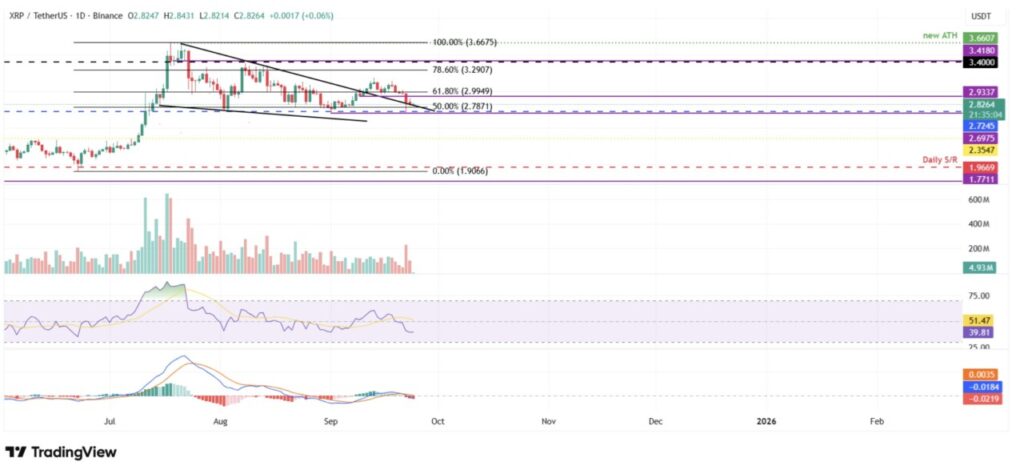
However, if XRP is able to recover, the recovery could continue towards the resistance level at $2.99.
That’s the latest information about crypto. Follow us on Google News to get the latest crypto news about crypto projects and blockchain technology. Also, learn crypto from scratch with complete discussion through Pintu Academy and stay up-to-date with the latest crypto market such as bitcoin price today, xrp coin price today, dogecoin and other crypto asset prices through Pintu Market.
Enjoy an easy and secure crypto trading experience by downloading Pintu crypto app via Google Play Store or App Store now. Also, get a web trading experience with various advanced trading tools such as pro charting, various types of order types, and portfolio tracker only at Pintu Pro.
*Disclaimer
This content aims to enrich readers’ information. Pintu collects this information from various relevant sources and is not influenced by outside parties. Note that an asset’s past performance does not determine its projected future performance. Crypto trading activities have high risk and volatility, always do your own research and use cold cash before investing. All activities of buying and selling bitcoin and other crypto asset investments are the responsibility of the reader.
Reference:
- FX Street. Top 3 Price Prediction: Bitcoin, Ethereum, Ripple – BTC, ETH and XRP momentum fades, signaling deeper corrections. Accessed on September 25, 2025