XRP price plummets again, is this the start of a drastic drop in October 2025? (9/10/25)
Jakarta, Pintu News – The price of Ripple experienced a sharp drop below $2,920, marking the beginning of a potential further decline. After failing to hold above $3,020, XRP is now in a short-term bearish zone, similar to what happened to Bitcoin and Ethereum .
Introduction: Ripple (XRP) Market Conditions
The price of Ripple (XRP) recently experienced a significant drop, where it was unable to maintain its position above $3,020 and continued to decline below $3,00 and $2,950. This decline put XRP into a short-term bearish zone, which may continue if the price remains below $2,850. Additionally, there was also a breakdown of the key descending channel with support at $2.90 on the hourly chart of the XRP/USD pair.
Also Read: Trading capital of IDR 20 thousand, is it possible? This is how to trade crypto with cheap capital!
Current Technical Analysis
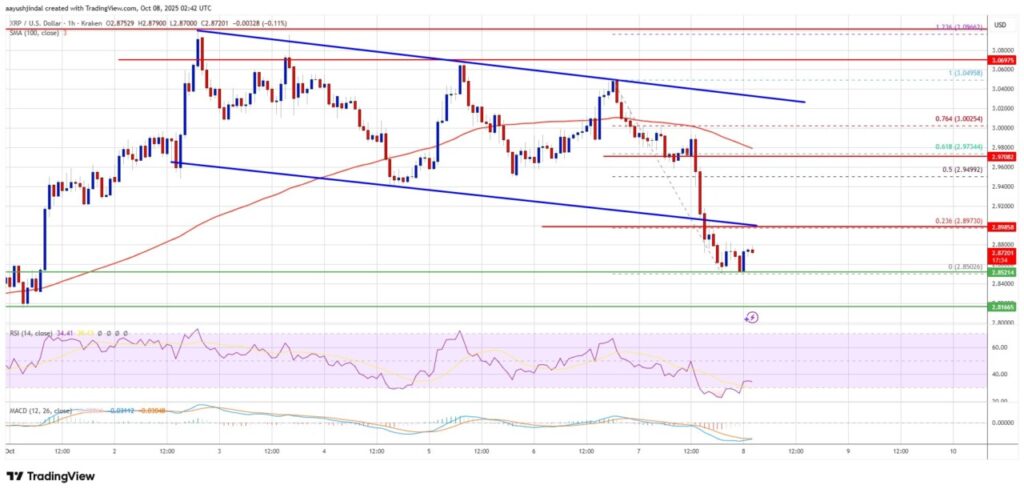
After failing to hold above $3,020, the price of XRP has continued to decline. Currently, the price is consolidating below the 23.6% Fibonacci retracement level of the move down from $3,049 to $2,850. The price is now trading below $2,920 and the 100-hour simple moving average. In case of an upside, the price may face resistance near $2.90. The first major resistance is near $2,950, which is the 50% Fibonacci retracement level of the same downside move.
Potential for Further Decline
If Ripple (XRP) fails to break the $3.00 resistance zone, there is a possibility that the price will drop again. Initial support lies near $2.850, followed by major support at $2.80. In case of a downward break and close below $2.80, the price could continue to drop towards $2.7250. The next major support is at the $2.650 zone, where if the price continues to drop, the next target could be around $2.60.
Technical Indicators
The hourly Moving Average Convergence Divergence (MACD) indicator for XRP/USD is currently showing acceleration within the bearish zone. Meanwhile, the hourly Relative Strength Index (RSI) for XRP/USD is below the 50 level, signaling more downside potential. The key support levels are at $2.850 and $2.80, while the key resistance levels are $2.90 and $2.920.
Conclusion
With the current market conditions, Ripple (XRP) investors and traders need to be wary of a potential further decline. Monitoring support and resistance levels, along with technical indicators, will be crucial in determining the next direction of the XRP price.
Also Read: 5 Coin Memes Predicted to Explode After Bitcoin Breaks $125,000
Follow us on Google News to get the latest information about the world of crypto and blockchain technology. Check today‘ s bitcoin price, today’s solana price, pepe coin and other crypto asset prices through Pintu Market.
Enjoy an easy and secure crypto trading experience by downloading Pintu crypto app via Google Play Store or App Store now. Also, get a web trading experience with various advanced trading tools such as pro charting, various types of order types, and portfolio tracker only at Pintu Pro.
*Disclaimer
This content aims to enrich readers’ information. Pintu collects this information from various relevant sources and is not influenced by outside parties. Note that an asset’s past performance does not determine its projected future performance. Crypto trading activities are subject to high risk and volatility, always do your own research and use cold hard cash before investing. All activities of buying andselling Bitcoin and other crypto asset investments are the responsibility of the reader.
Reference
- NewsBTC. XRP Price Dips Below Key Support, Can Bulls Save the Day? Accessed on October 9, 2025