Pi Network Slides Further Today — Bearish Pressure Mounts on Pi Coin

Jakarta, Pintu News – As of October 21, the price of Pi Network recorded a 2% drop in 24 hours and 4.5% in a week, extending a monthly correction that now stands at 43%. Currently, the token is stuck in a narrow range around $0.20, with neither buyers nor sellers able to take full control of the market direction.
However, recent signals suggest a clear gap between bullish and bearish forces. Although selling pressure has begun to weaken, various leading indicators still reflect fragile market conditions, where price declines are more likely than a potential Pi Coin price recovery.
Then, how will the Pi Network price move today?
Pi Network Price Drops 1.3% within 24 hours
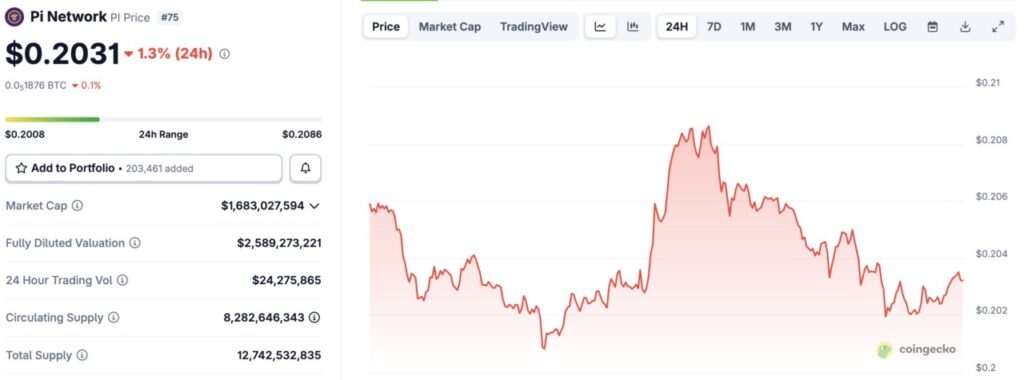
On October 22, 2025, the price of Pi Network was recorded at $0.2031, a decrease of 1.3% in 24 hours. If converted to the current rupiah ($1 = Rp16,620), then 1 Pi Network is Rp3,375.
Read also: Fraud Alert: Fake Pi Network Tokens Surface on Prashu DEX
Throughout the day, the PI price moved in a narrow range between $0.2008 to $0.2086, reflecting relatively low volatility but remaining on a downward trend.
The current market capitalization is recorded at $1,683,027,594, while the trading volume in the last 24 hours reached $24,275,865, indicating that there is still transaction activity despite the selling pressure seen from the downward trend in prices.
Two Bearish Indicators Keep Bullish Parties Under Pressure
There are two technical indicators showing that the bulls are still on the defensive.
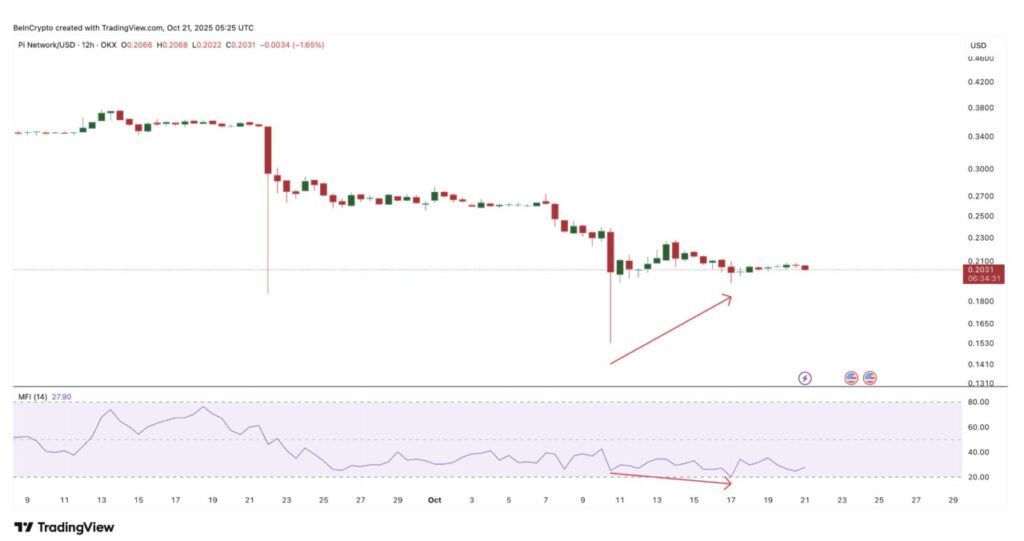
Firstly, the Money Flow Index (MFI) – an indicator that measures the inflow and outflow of money from an asset – showed a bearish divergence. Between October 10 and 17, Pi Coin’s price formed a higher low, but the MFI recorded a lower low.
This pattern signals that although the price looks stable, the buying strength is actually weakening, indicating that retail traders tend to hold back.
Secondly, the Chaikin Money Flow (CMF) – which reflects large money flows from institutional investors – is still slightly above the zero line (positive), but has fallen sharply since October 20. A decline in CMF while still positive usually signals that while large investors have not completely exited, they are starting to reduce new purchases.
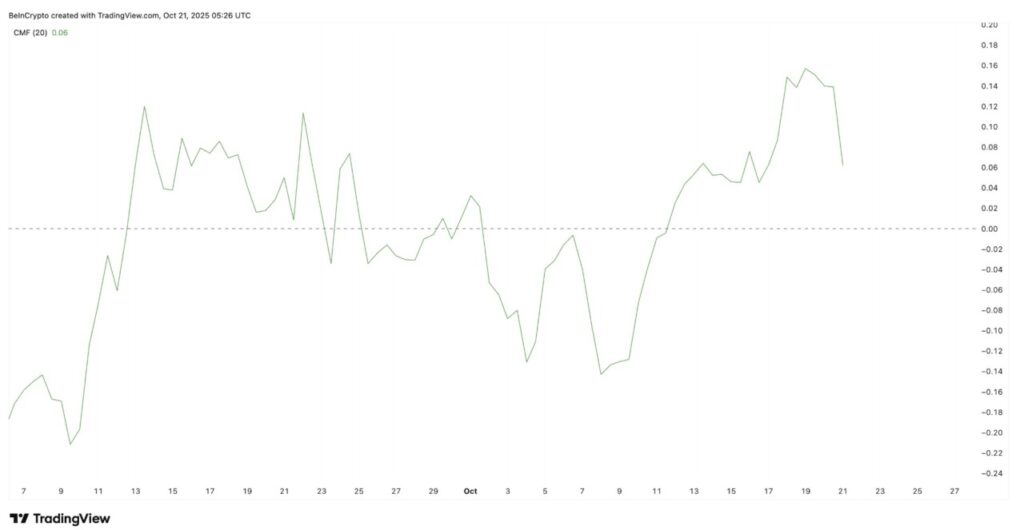
This combination of declines in MFI and CMF suggests that demand from both small and large investors is starting to weaken. If fund inflows do not improve, the potential recovery in Pi Coin’s price is likely to be temporary and easily contained.
One Bullish Signal that Keeps the Market Structure from Going Completely Negative
Amidst the market pressure dominated by bearish sentiment, there is one indicator that still maintains Pi Coin’s short-term bullish structure, which is Bull Bear Power (BBP) – an indicator that measures the difference between buying and selling power.
Read also: DOGE’s Drop Deepens — Have the Bears Taken Control of the Market?
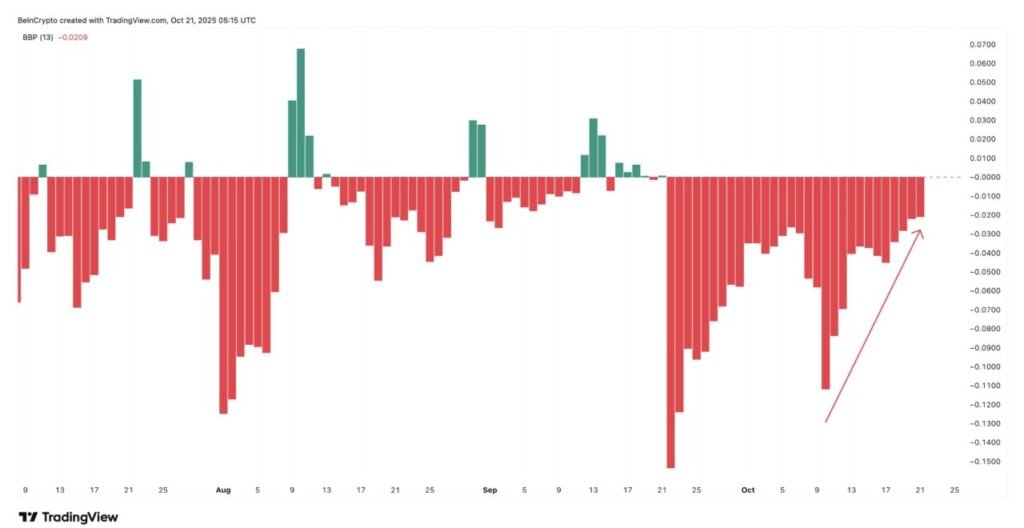
Since October 7, the bearish momentum has been gradually weakening. This can be seen from the red bars on the chart getting smaller, indicating that the pressure from sellers is starting to lose steam.
While not yet a signal of a full trend reversal, this consistent decrease in bearish strength suggests that the downward pressure is slowly easing. This is the only factor currently preventing Pi Coin’s technical structure from completely collapsing.
Pi Coin’s Falling Wedge Pattern Shows Extreme Two-Way Fighting
On the daily chart (10/21), Pi Coin is still moving within a falling wedge pattern – a pattern that usually precedes a bullish reversal. However, the breakout point of this pattern is still well above the current price.
To confirm an upside move, PI price needs to rally around 34% and successfully break the $0.27 level (the strongest short-term resistance), and then close above $0.29 to cross the upper boundary of the wedge. If this happens, the next price target could be $0.30 and even $0.34.
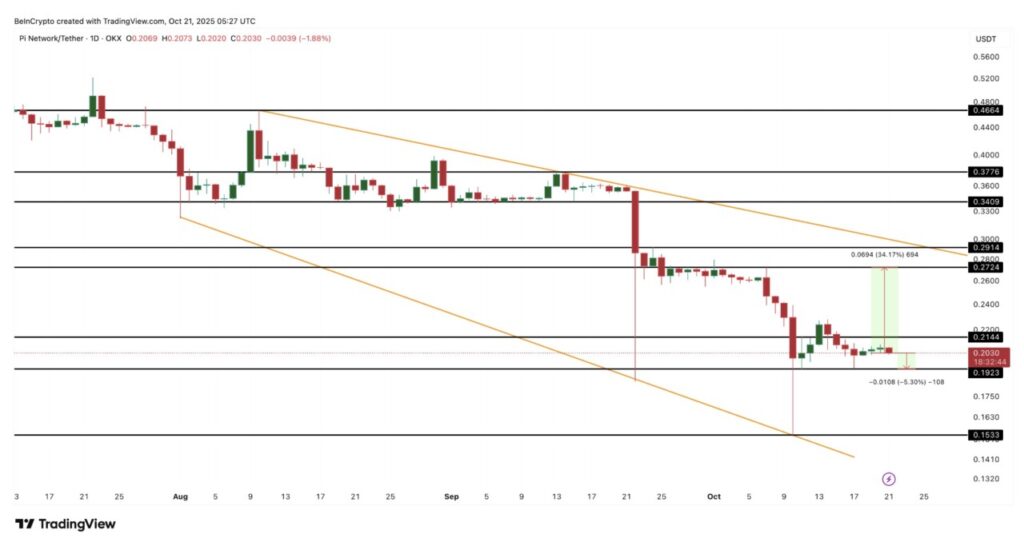
However, the bearish scenario is much easier to happen. If the price drops net below $0.19, Pi Coin could potentially fall quickly to $0.15, which is the area of the wedge’s lower trendline. But since this lower trendline only has two clear touch points, its strength is relatively weak – and a break below it could pave the way for a deeper drop.
In conclusion, the bearish side currently has a shorter path to “win”. A 5% drop is enough to confirm a breakdown, while the bullish side needs more than six times that to achieve a breakout.
That’s the latest information about crypto. Follow us on Google News to get the latest crypto news about crypto projects and blockchain technology. Also, learn crypto from scratch with complete discussion through Pintu Academy and stay up-to-date with the latest crypto market such as bitcoin price today, xrp coin price today, dogecoin and other crypto asset prices through Pintu Market.
Enjoy an easy and secure crypto trading experience by downloading Pintu crypto app via Google Play Store or App Store now. Also, get a web trading experience with various advanced trading tools such as pro charting, various types of order types, and portfolio tracker only at Pintu Pro.
*Disclaimer
This content aims to enrich readers’ information. Pintu collects this information from various relevant sources and is not influenced by outside parties. Note that an asset’s past performance does not determine its projected future performance. Crypto trading activities have high risk and volatility, always do your own research and use cold cash before investing. All activities of buying and selling bitcoin and other crypto asset investments are the responsibility of the reader.
Reference:
- BeInCrypto. Pi Coin Price Caught Between Bulls and Bears – But One Side Has the Edge. Accessed on October 22, 2025


