Solana (SOL) Price Plunges to Support Point, Recovery Opportunities Lurking? (10/31/25)

Jakarta, Pintu News – Solana has recently experienced a significant drop after failing to break the $205 resistance level. In recent moves, SOL has broken below $200 and $198, entering a short-term bearish zone. Nonetheless, there are indications that buyers are becoming active near the $192 support, suggesting a potential recovery base.
Technical Analysis of Solana (SOL)
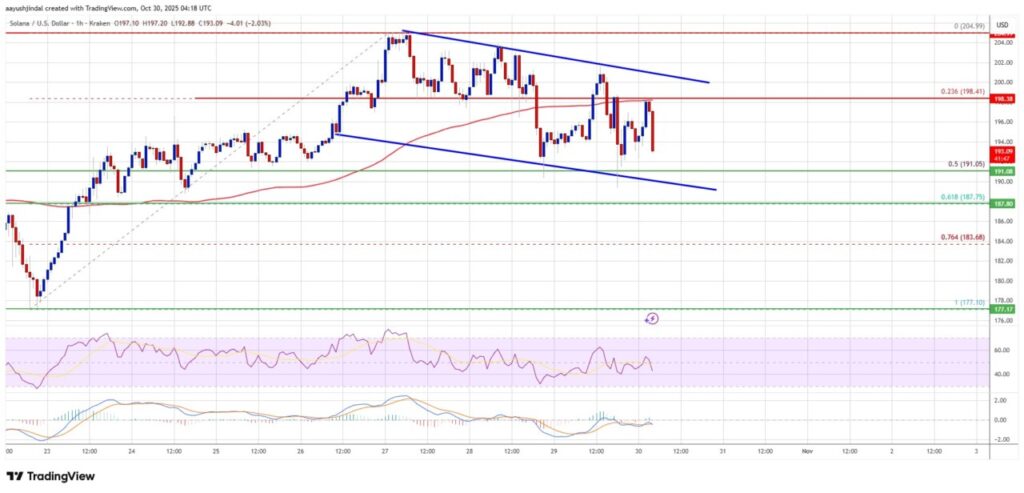
Solana (SOL) declined below the 23.6% Fibonacci retracement level of the upward wave from $177 to $205. Currently, SOL is trading below $195 and the 100-hour simple moving average. There is a descending channel forming with resistance at $200 on the hourly chart of the SOL/USD pair. If SOL manages to break above the $205 resistance zone, this could be the start of a steady rise.
On the other hand, the nearest resistance is seen around $198. If SOL is unable to break this resistance, there is a possibility that the price will drop again. Initial support lies in the $192 zone, followed by primary support at $188. A break below this could push SOL towards the $184 support zone.
Also Read: 5 Strong Signals Dogecoin (DOGE) Could Explode in November: Here’s What Analysts Say
Solana (SOL) Price Recovery Potential
If Solana (SOL) manages to break above $205, it could pave the way for further gains. The next key resistance is $220, and further upside might steer the price towards $225. Investors and market analysts are watching closely to see if SOL can maintain its momentum above these critical levels.
Solana’s (SOL) price recovery depends largely on the market’s ability to absorb the selling and turn bearish sentiment into bullish. If this happens, SOL could see a significant recovery from its current position.
Risk of Further Decline
If Solana (SOL) fails to hold support at $192 and continues to fall, it could trigger further declines. A break below $188 could send the price towards $184, and if a close below this occurs, SOL may look for support at $177 in the short term. Technical indicators are currently showing increasing bearish momentum. The hourly MACD for SOL/USD shows acceleration in the bearish zone, and the hourly RSI (Relative Strength Index) is below the 50 level, indicating further bearish strength.
Conclusion
Although Solana (SOL) is facing significant selling pressure, there is potential for recovery if it can maintain critical support and break through existing resistance. Investors should monitor technical indicators and trading volumes to gain further insight into SOL’s future price direction.
Also Read: Will Ripple (XRP) Surge Before 2030? Check out his bold prediction!
Follow us on Google News to get the latest information about the world of crypto and blockchain technology. Check today‘ s bitcoin price, today’s solana price, pepe coin and other crypto asset prices through Pintu Market.
Enjoy an easy and secure crypto trading experience by downloading Pintu crypto app via Google Play Store or App Store now. Also, get a web trading experience with various advanced trading tools such as pro charting, various types of order types, and portfolio tracker only at Pintu Pro.
*Disclaimer
This content aims to enrich readers’ information. Pintu collects this information from various relevant sources and is not influenced by outside parties. Note that an asset’s past performance does not determine its projected future performance. Crypto trading activities are subject to high risk and volatility, always do your own research and use cold hard cash before investing. All activities of buying andselling Bitcoin and other crypto asset investments are the responsibility of the reader.
Reference
- NewsBTC. Solana (SOL) Drops Toward Support at $188. Accessed on October 31, 2025