Can XRP Price Soar in November 2025? Here’s the Analysis
Jakarta, Pintu News – October has not been a good month for the price of XRP . Over the course of the month, the token has dropped by more than 12%, mirroring a similar drop that occurred in October 2024.
As November begins, traders are starting to wonder if XRP can repeat its stellar performance in November last year, when its price surged more than 280%. Even if they only get a fraction of that surge, XRP traders will likely be satisfied.
On-chain data currently shows a mixed bag – the majority of XRP holders are seen selling, while some whales have started adding to their holdings. The price of XRP itself is still moving in a narrow pattern that has the potential to experience sharp movements in either direction.
Long and Short Term Investors Continue to Liquidate Assets
The Hodler Net Position Change metric, which measures the difference between XRP coming in and going out of long-term wallets, shows that long-term investors are getting more aggressive in selling.
Read also: Pi Network Sees Modest Price Uptick — What’s ChatGPT’s Outlook for Pi Coin?
On October 19, the outflow was recorded at -3.28 million XRP. However, by October 30, the figure had jumped dramatically to -90.14 million XRP.
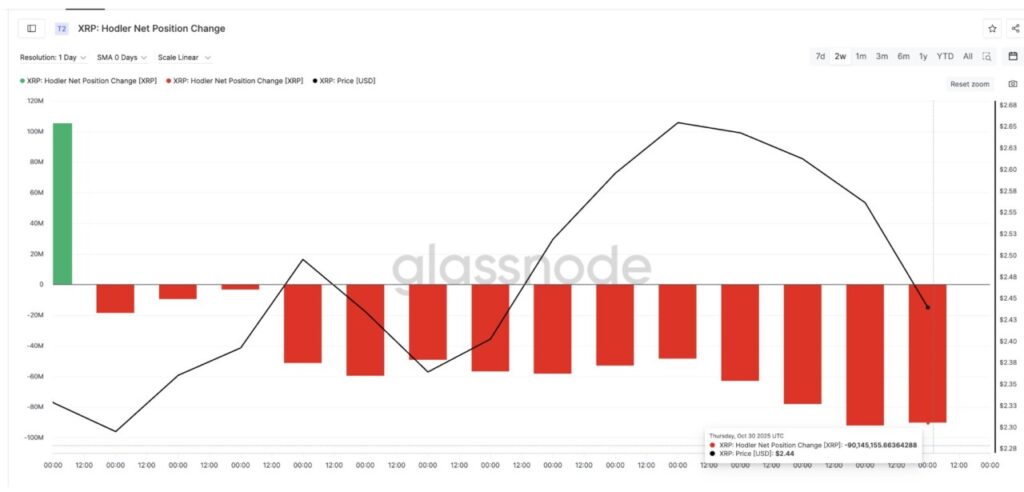
This represents a 2,647% increase in net outflows in just two weeks – signaling that long-term investors are accelerating their sell-off instead of holding back.
Meanwhile, the Hodl Waves chart, which categorizes XRP supply by age of ownership, shows a similar trend among short-term investors. The group of 1-3-month-old XRP owners – which represents new investors – saw their share of ownership drop from 12.98% in early October to just 7.85% today, or a sharp drop of 39.5%.
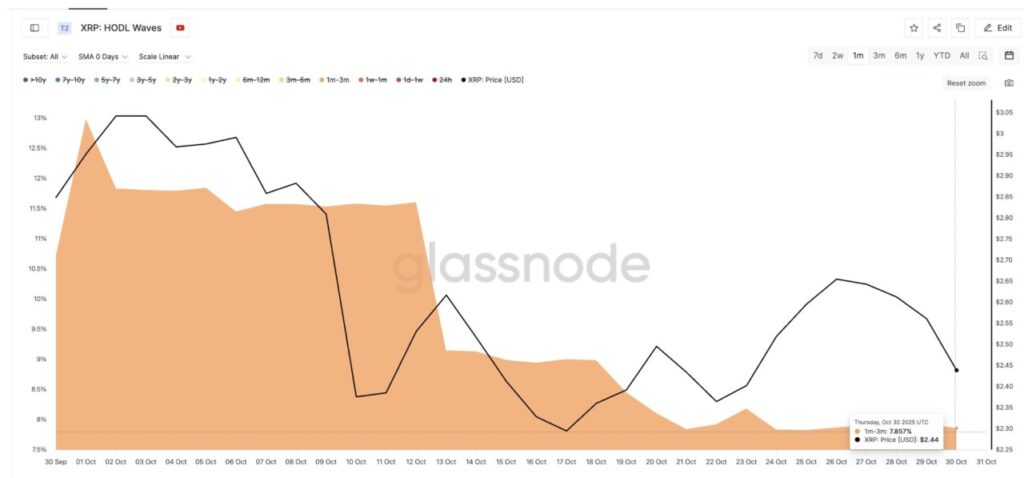
This consistent decline indicates that short-term traders are starting to exit the market as volatility increases.
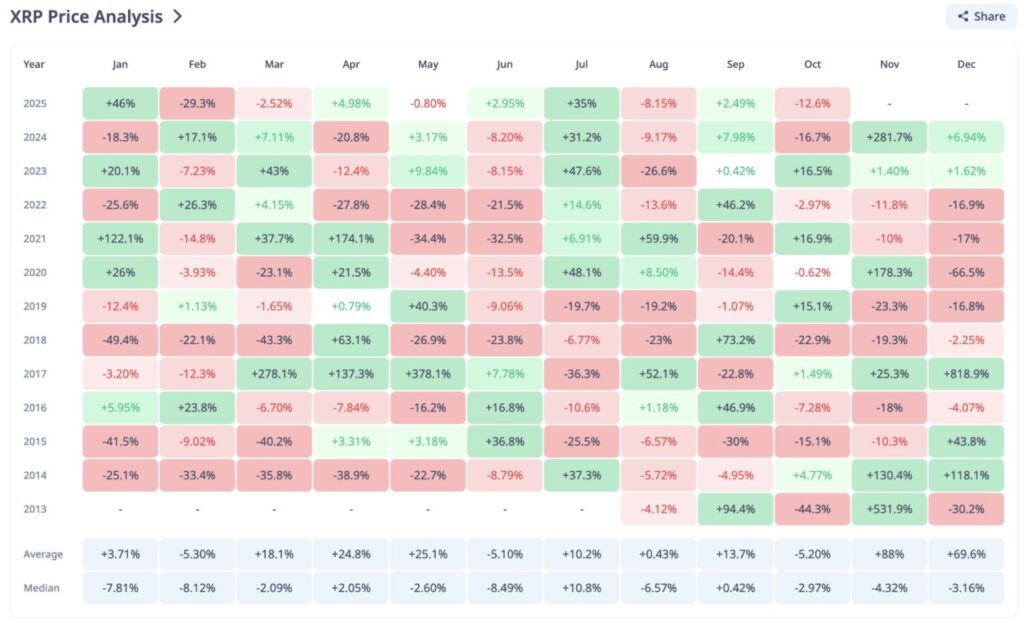
Interestingly, November has historically been the strongest period for XRP, with an average price increase of +88% and a median increase of +25%.
However, the positive performance in November is usually dependent on accumulation from this group of investors. With the current selling pressure, the possibility of a repeat performance this year is limited – unless the whales step in and replace the selling pressure with accumulation.
Whales Quietly Accumulate Ahead of November
While small investors are reducing their exposure to XRP, large wallets are quietly accumulating.
Whales holding between 100 million and 1 billion XRP have seen their holdings increase significantly in the past two weeks. Their total stash rose from 6.97 billion XRP on October 16 to 8.24 billion XRP on October 31 – an increase of 1.27 billion XRP, which is equivalent to about $3.15 billion assuming the current price of $2.48 per XRP.
Read also: Dogecoin Drops to $0.18 as Long‑Term Holders Begin Offloading
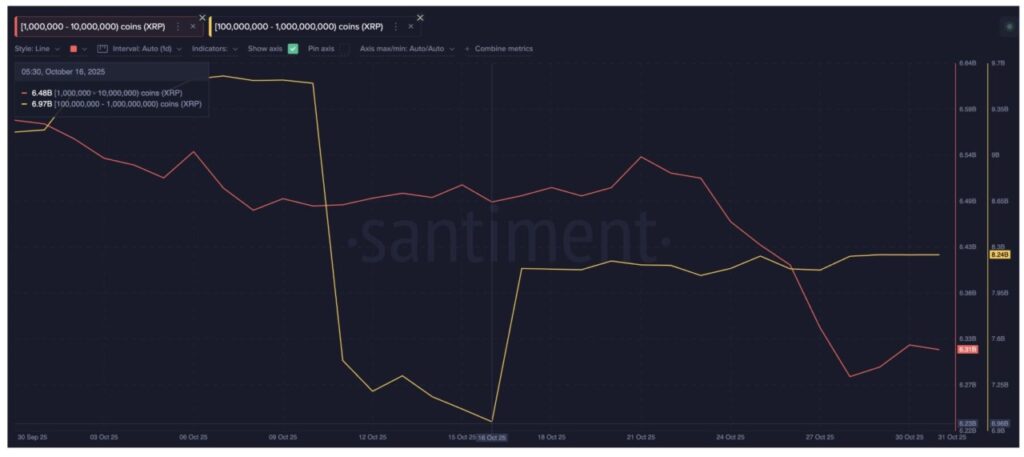
This contrasts with the behavior of mid-range whales, those holding between 1 million and 10 million XRP, who actually made more net sales throughout October. However, this trend seems to be changing.
Between October 28 and 30, their balance increased from 6.28 billion to 6.31 billion XRP – an increase of about 30 million XRP or approximately $74 million.
The return of accumulation from this group of intermediate whales is often an early signal of price stabilization – which is an important step towards a sustained price rally.
Maria Carola, CEO of StealthEx, thinks that these changes reflect the maturing market structure. She also revealed some important levels where accumulation is most likely to form:
“XRP’s current market structure shows more mature dynamics, with measured accumulation and more disciplined exposure. A strong support base has formed in the range of $2.60-$2.63 – a key zone that will determine the direction of price movement in the short term,” he said.
It will be interesting to see if in November, the whale buying can offset the selling pressure from other investor groups.
Supply Zones, XRP Price Levels, and Triggers for the Next Move
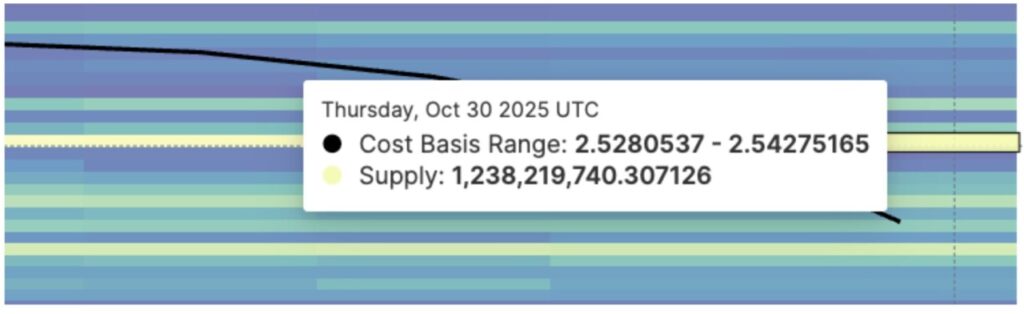
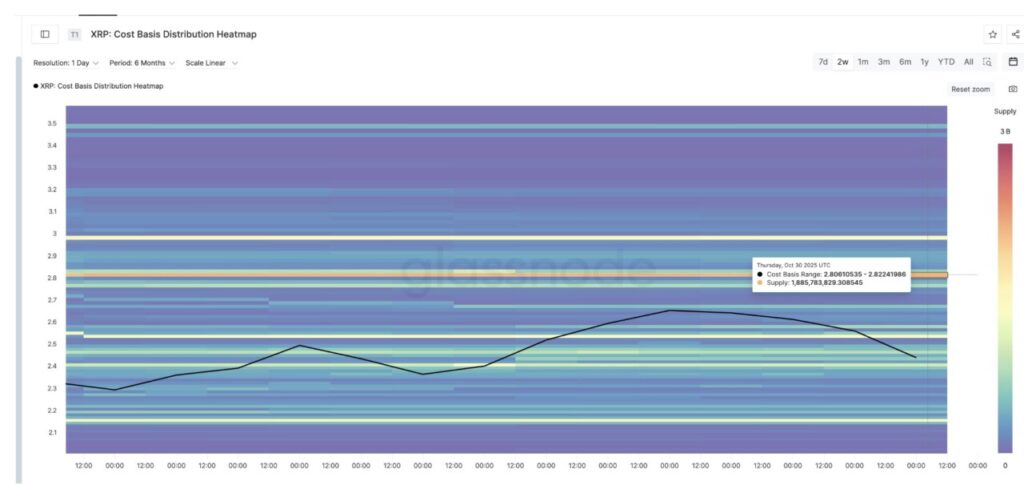
The cost-basis distribution heatmap, which shows where most tokens were last purchased, reveals two large supply zones that are the main obstacles to XRP’s price increase.
The first zone is in the range of $2.52-$2.54, where about 1.23 billion XRP has been accumulated. This explains why the price of XRP has failed to stay above the $2.59 level several times.
The second stronger zone lies between $2.80 to $2.82, with approximately 1.88 billion XRP purchased in that area. This level is a key determinant of whether XRP is able to break the long-term uptrend in a sustainable manner.
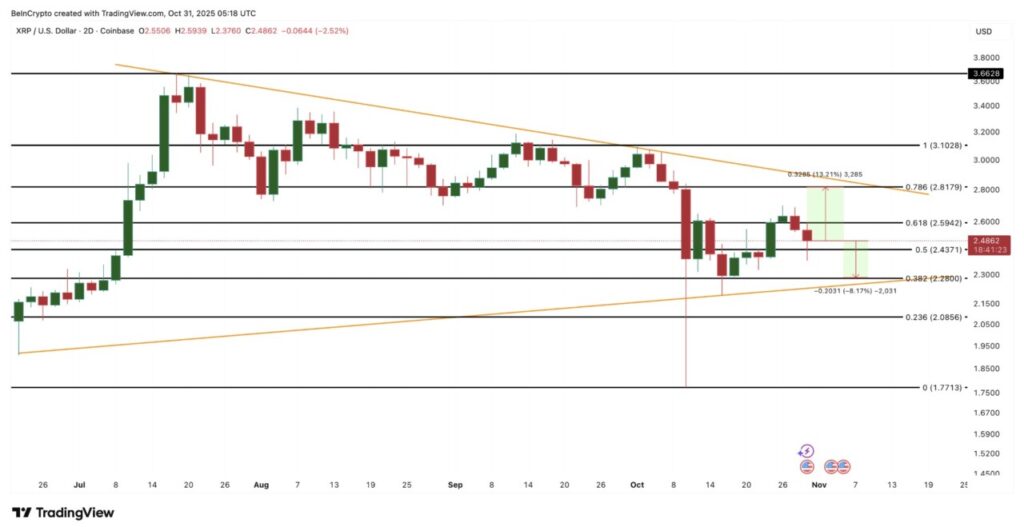
At the same time, the 2-day price chart shows that XRP is in a consolidation phase, forming a symmetrical triangle pattern – reflecting the push and pull between buying and selling pressure. However, the lower trendline in this pattern has only two touchpoints, making it quite weak. This opens up the opportunity for a short-term correction if selling pressure picks up again.
Maria Carola provided an additional view that emphasized the importance of the previously mentioned $2.59 price level:
“As long as XRP is able to hold above $2.60, the easier direction of movement remains to the upside. If it can break the $2.67-$2.70 level supported by new capital rotation, there is potential to retest the $3 price, especially if macroeconomic factors are favorable,” he said.
If there is a breakout above $2.81 (as confirmed by the data from the heatmap), then the bullish opportunity will become stronger. This could push the price towards $3.10 and even up to $3.66. Conversely, if the price drops below $2.28, there is a risk of a further drop to the area around $2.08.
However, the current wave of sell-offs and weak lower trendline make a short-term decline quite likely, especially if market conditions worsen. This could extend the correction phase before XRP tries to bounce back.
That’s the latest information about crypto. Follow us on Google News to get the latest crypto news about crypto projects and blockchain technology. Also, learn crypto from scratch with complete discussion through Pintu Academy and stay up-to-date with the latest crypto market such as bitcoin price today, xrp coin price today, dogecoin and other crypto asset prices through Pintu Market.
Enjoy an easy and secure crypto trading experience by downloading Pintu crypto app through Google Play Store or App Store now. Also, get a web trading experience with various advanced trading tools such as pro charting, various types of order types, and portfolio tracker only at Pintu Pro.
*Disclaimer
This content aims to enrich readers’ information. Pintu collects this information from various relevant sources and is not influenced by outside parties. Note that an asset’s past performance does not determine its projected future performance. Crypto trading activities have high risk and volatility, always do your own research and use cold cash before investing. All activities of buying and selling bitcoin and other crypto asset investments are the responsibility of the reader.
Reference:
- BeInCrypto. XRP Price Outlook November 2025. Accessed on November 3, 2025


