Dogecoin Hits $0.15 Amid Surge Triggered by ETF Launch
Jakarta, Pintu News – Dogecoin has experienced a consistent decline since its peak in November 2024. There was a brief attempt at recovery in September 2025, but it quickly lost momentum and DOGE continued to slide, hitting a yearly low earlier this month.
However, late last week, DOGE finally experienced a price bounce, following the rebound trend that also occurred in a number of other meme coins such as Fartcoin . One of the main triggers that allegedly drove this rise was the launch of Grayscale’s Dogecoin ETF(exchange-traded fund), which officially started trading today.
ETF debuts usually attract an influx of institutional funds, and ETF launches for other cryptocurrencies have sparked short-term rallies in the past. Now, traders are watching closely to see if the Dogecoin ETF will have a similar positive effect, or if this bounce will end like previous rebounds that failed to hold.
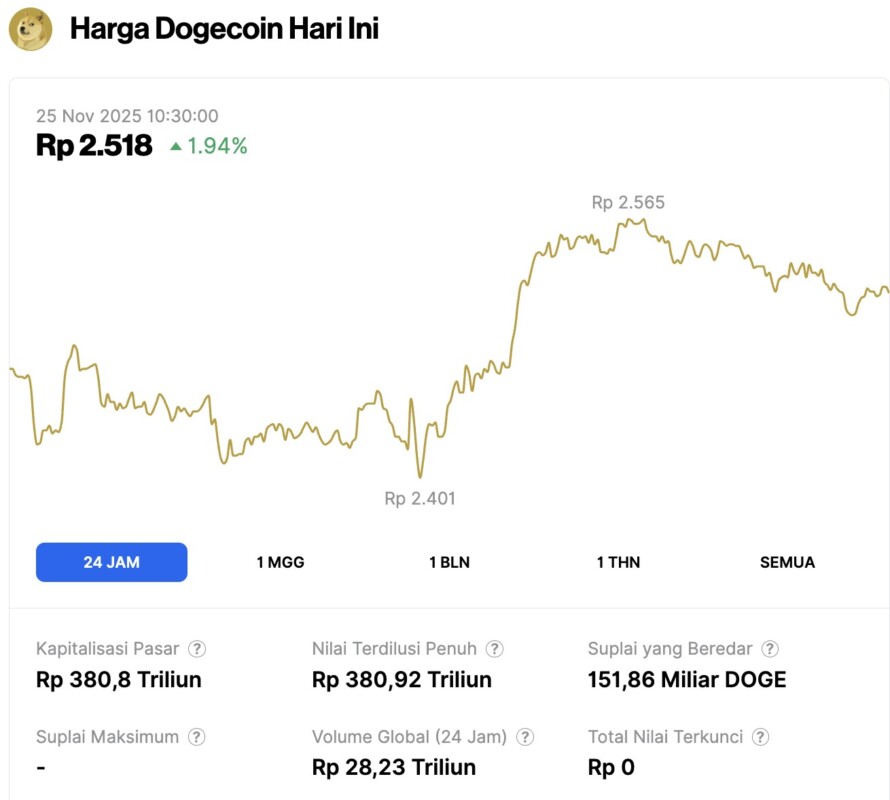
Dogecoin Price Rises 1.94% in 24 Hours
Read also: Ethereum Climbs to $2,900 Today: Is a Bigger Rally on the Horizon?
On November 25, 2025, Dogecoin saw a 1.94% gain over the past 24 hours, trading at $0.1515 — approximately IDR 2,518. During this period, DOGE fluctuated between IDR 2,401 and IDR 2,565.
At the time of writing, Dogecoin’s market capitalization is estimated at around IDR 380.8 trillion, with a 24-hour trading volume of roughly IDR 28.23 trillion.
Dogecoin ETF triggers price rally
Since early September, Dogecoin (DOGE) has formed afive-wave decline pattern, with the last wave forming a diagonal ending pattern-a patternthat is often considered a sign that the downtrend is starting to lose steam.
This pattern is important because the ending diagonal usually appears at the end of a major selling phase and can be an early signal that the momentum direction is starting to reverse. Currently, the momentum indicator is starting to support the possibility of such a reversal.
The Relative Strength Index (RSI) indicator shows a bullish divergence, which is when the price prints a new low, but the RSI forms a higher low. This is a classic signal that selling pressure is starting to weaken.
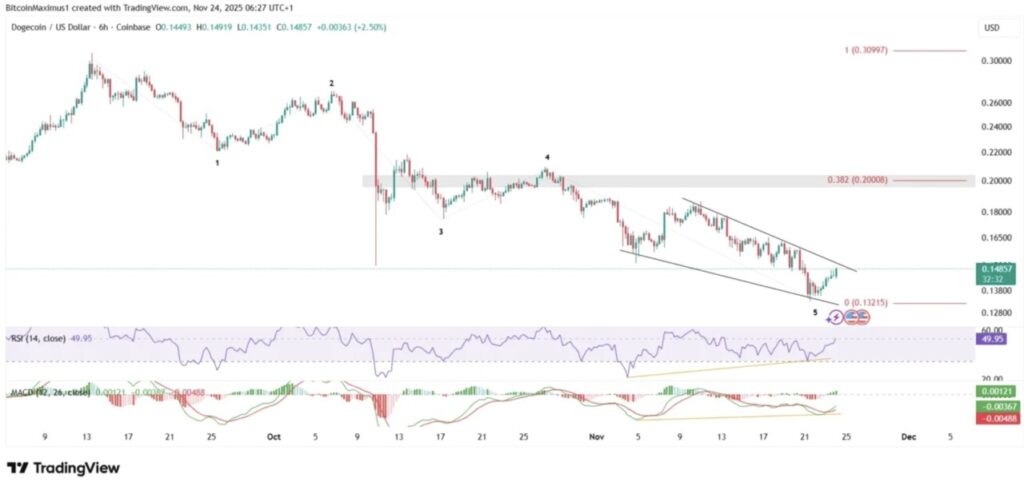
The RSI is also approaching the key level of 50. If it manages to break above this level, it usually signals the beginning of a trend reversal. In addition, the Moving Average Convergence/Divergence (MACD) indicator is also showing a similar divergence.
If the Dogecoin price manages to break out of the wedge pattern formed, a quick spike to the horizontal area around $0.20 is highly likely. This breakout would confirm the end of the five-wave bearish pattern.
Rotational moves in the memecoin market like this often trigger sharp rallies in DOGE, as traders get back into the biggest meme coins by market capitalization.
Long-term Trend Still Bearish
Although the short-term chart gives hope for a price bounce, the weekly chart shows a clear bearish trend.
The weekly chart shows the moment when the trend turned down (marked by the red icon). In November, Dogecoin broke the upside support trend line that had been in place for 763 days. This was significant because it signaled that the uptrend of the past two years was over.
As a result of this breakout, traders are now eyeing a potential drop towards $0.115, which is the nearest horizontal support area – about 20% below the current price.
Read also: Bitcoin Holds Steady at $87,000, Is a 10–12% Price Surge on the Horizon?
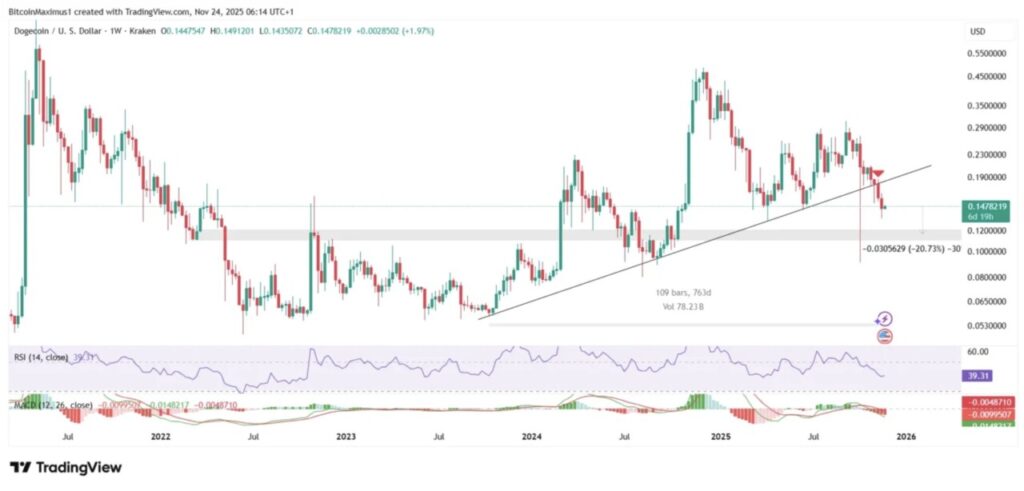
Momentum indicators reinforce this negative view. The RSI dropped below the 50 level, indicating the dominance of the bearish trend. This signal becomes even stronger when combined with the MACD movement, which has also turned negative, confirming the change in trend direction.
If these signals continue, Dogecoin will most likely continue to fall in the long term, with a downside target of at least the $0.115 range.
Why is the Dogecoin price rising?
The main reason why Dogecoin surged over the weekend and continues to rise today is the launch of Grayscale’s Dogecoin ETF which is scheduled to officially launch today.
ETFs like this usually attract liquidity from institutional investors, which can push asset prices up significantly. Given the bullish short-term technical signals, the price of DOGE has the potential to break out of the wedge pattern and rise to the $0.200 area.
However, the long-term projection still remains bearish. Dogecoin is expected to weaken again and most likely drop to the next support level around $0.115.
Traders are advised to closely monitor the movement of DOGE – specifically whether the price manages to break out of the wedge pattern, and then watch the market reaction at the $0.20 area as the next key level.
That’s the latest information about crypto. Follow us on Google News to get the latest crypto news about crypto projects and blockchain technology. Also, learn crypto from scratch with complete discussion through Pintu Academy and stay up-to-date with the latest crypto market such as bitcoin price today, xrp coin price today, dogecoin and other crypto asset prices through Pintu Market.
Enjoy an easy and secure crypto trading experience by downloading Pintu crypto app via Google Play Store or App Store now. Also, get a web trading experience with various advanced trading tools such as pro charting, various types of order types, and portfolio tracker only at Pintu Pro.
*Disclaimer
This content aims to enrich readers’ information. Pintu collects this information from various relevant sources and is not influenced by outside parties. Note that an asset’s past performance does not determine its projected future performance. Trading crypto carries high risk and volatility, always do your own research and use cold hard cash before investing. All activities of buying and selling bitcoin and other crypto asset investments are the responsibility of the reader.
Reference:
- CCN. Dogecoin (DOGE) Price Surges 10% Ahead of Grayscale’s GDOG ETF Launch Today. Accessed on November 25, 2025