Will Bitcoin Rise from Bearish Pressure in December 2025?

Jakarta, Pintu News – Bitcoin is now trading around 30% below its record high of $126,000, indicating a market still plagued by selling pressure, uncertainty, and waning confidence. This sharp decline has rattled investors who expected a steady rise, and many analysts have begun to argue that this cycle may have peaked.
Indications of Bitcoin Recovery Begin to Show
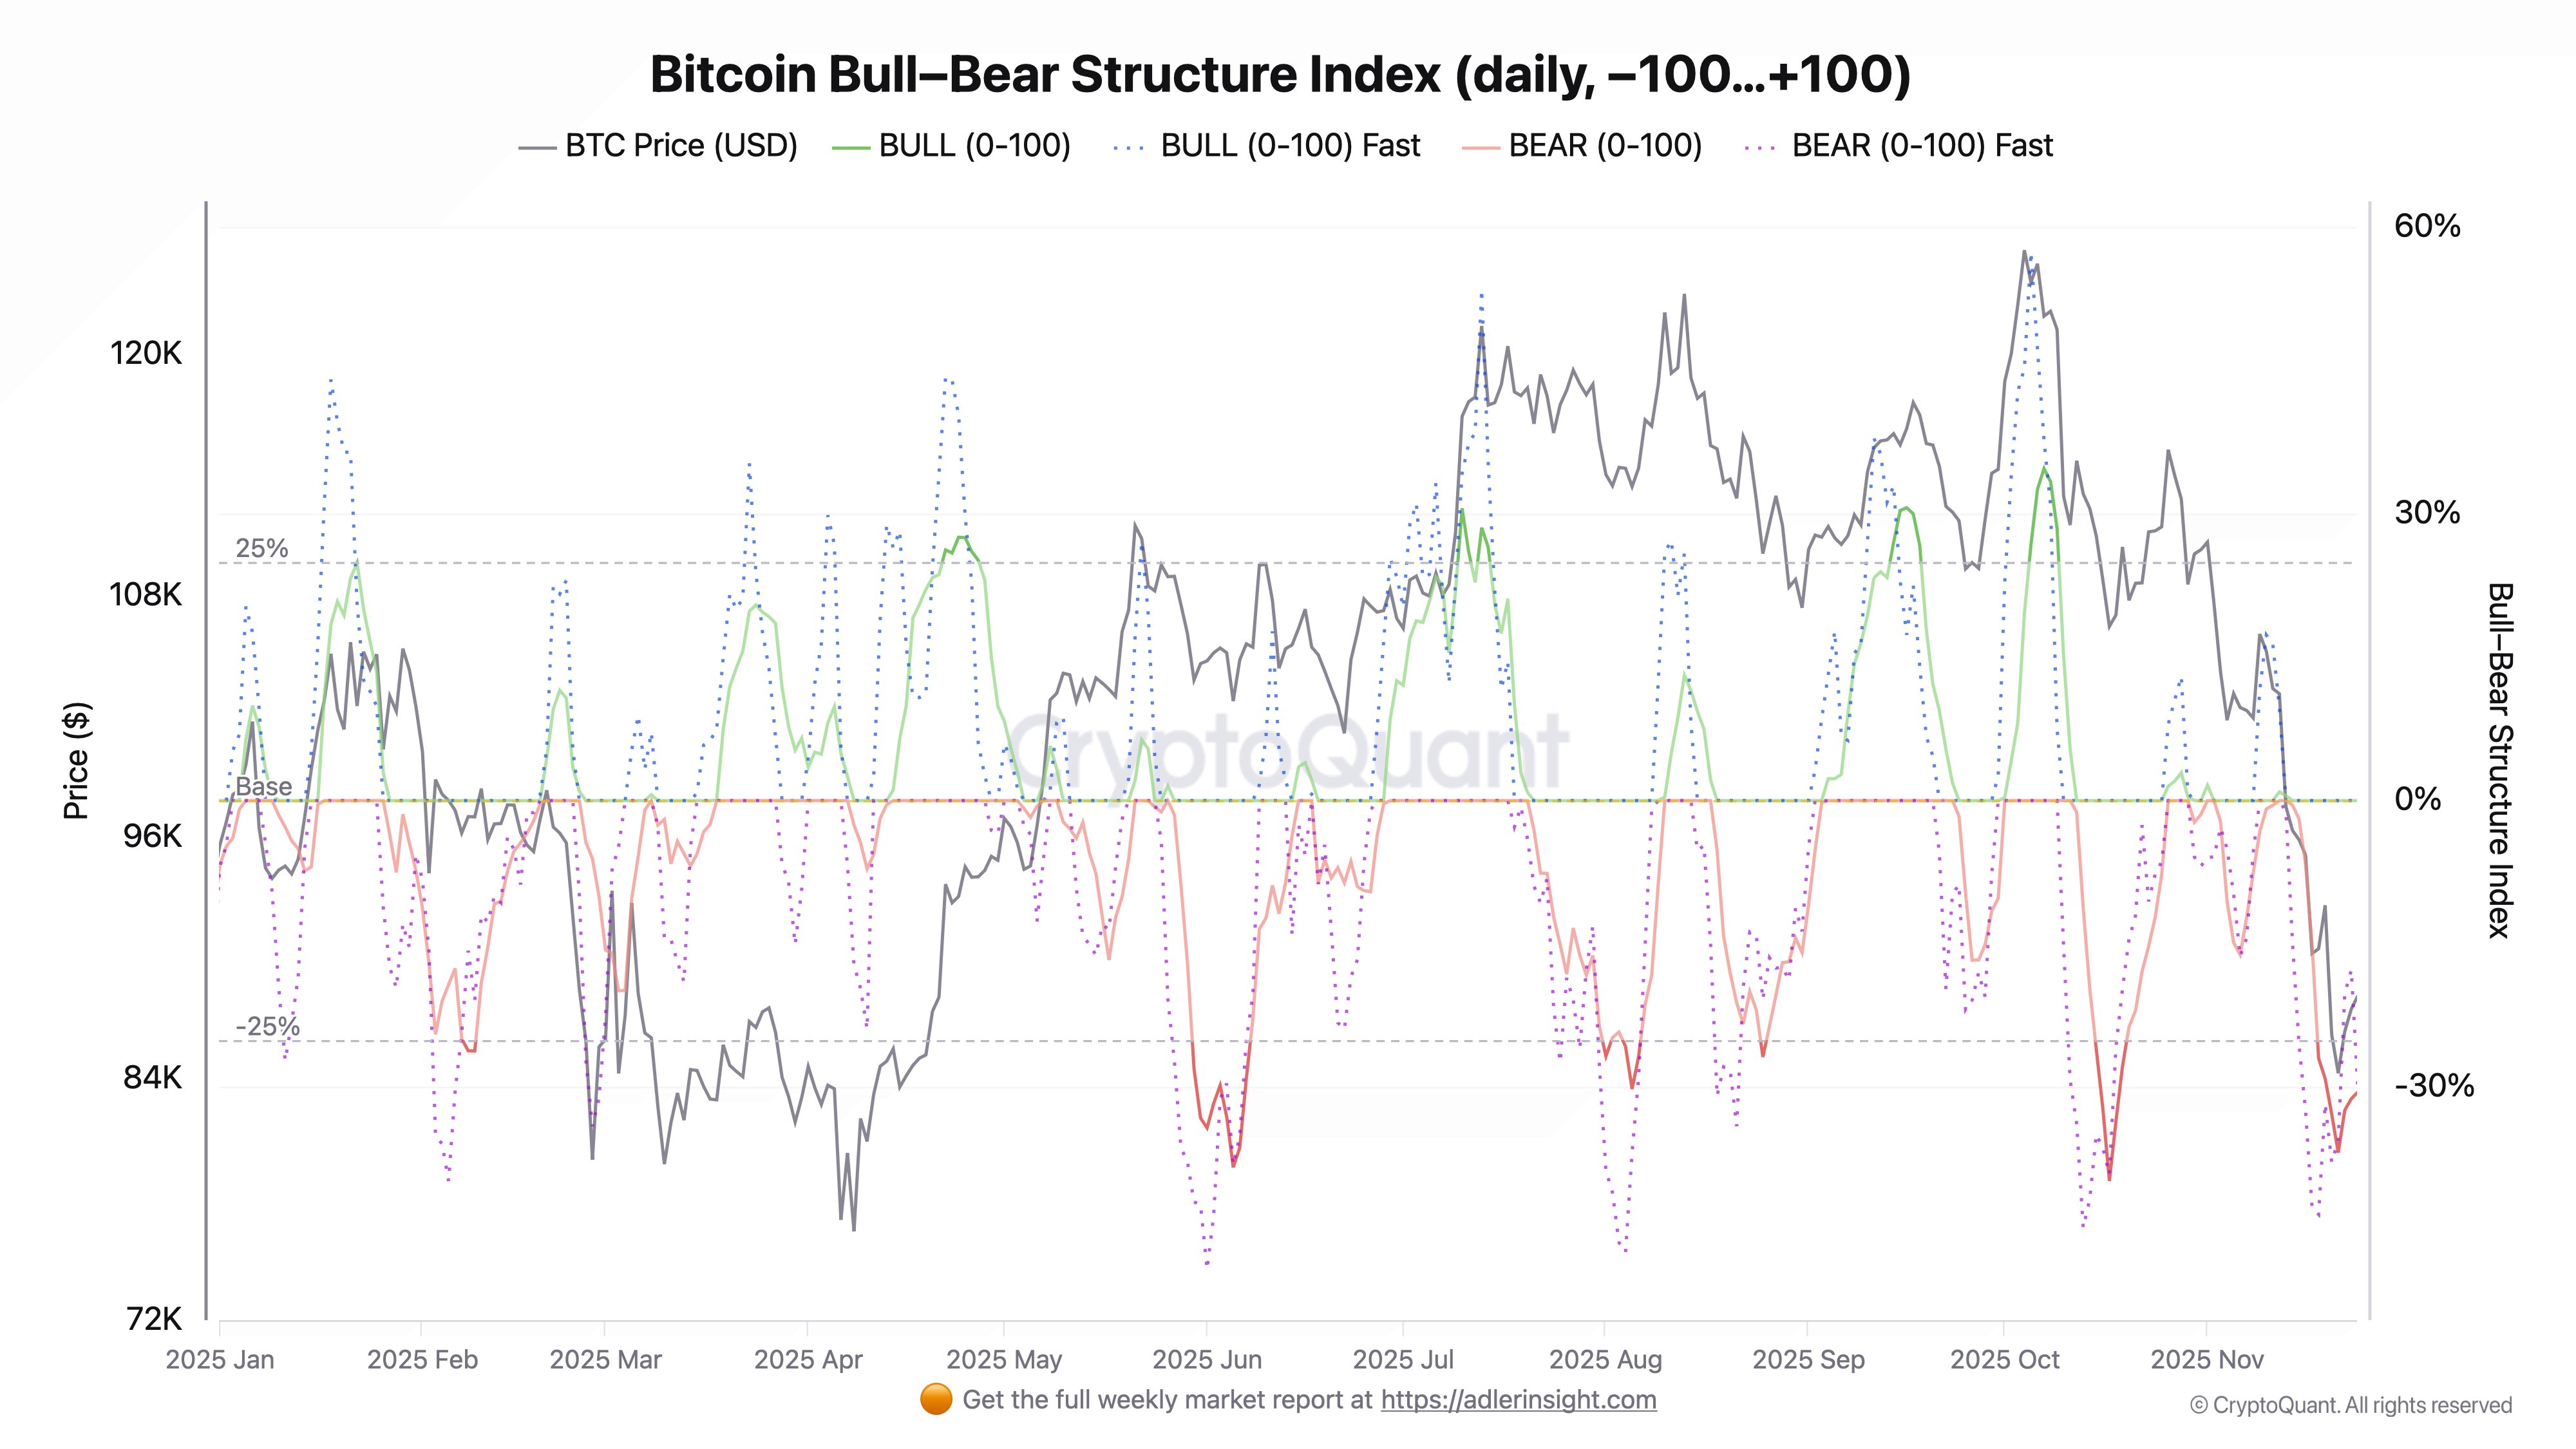
According to leading analyst, Axel Adler, the Bitcoin Bull-Bear Structure Index and Futures Flow Index are still in a bearish regime, signaling that the market structure still favors downside risks.
However, Adler highlighted that Bitcoin is currently trading 11% below its 30-day fair value of $99.2K, indicating a significant mismatch between the price and the underlying derivative positions.
These mismatches have historically appeared near the corrective exhaustion zone rather than early-stage declines. Moreover, short-term dynamics in both indices show early signs of a reversal attempt, with selling pressure slowly weakening and momentum starting to stabilize.
Also Read: 7 Ways to Buy and Sell Tokenized Gold at the Door, Starting from Rp11,000 and Can be 24/7
Bearish structure weakens as Bitcoin tries to stabilize
Bitcoin’s daily bull and bear structure index shows a sustained shift to the bearish side since November 11, reflecting the strongest downward momentum in this cycle. The red BEAR line moved deep into negative territory at -36%, signaling the dominance of persistent selling pressure.
However, indicators are now starting to reverse, suggesting that the most aggressive bearish control phase may be starting to subside. At the same time, Bitcoin is consolidating around $87,000 after briefly plunging to $80,000, marking an initial attempt to stabilize and build support after a sharp decline.
Weekly Structure Tests Key Support Amid Stabilization Efforts
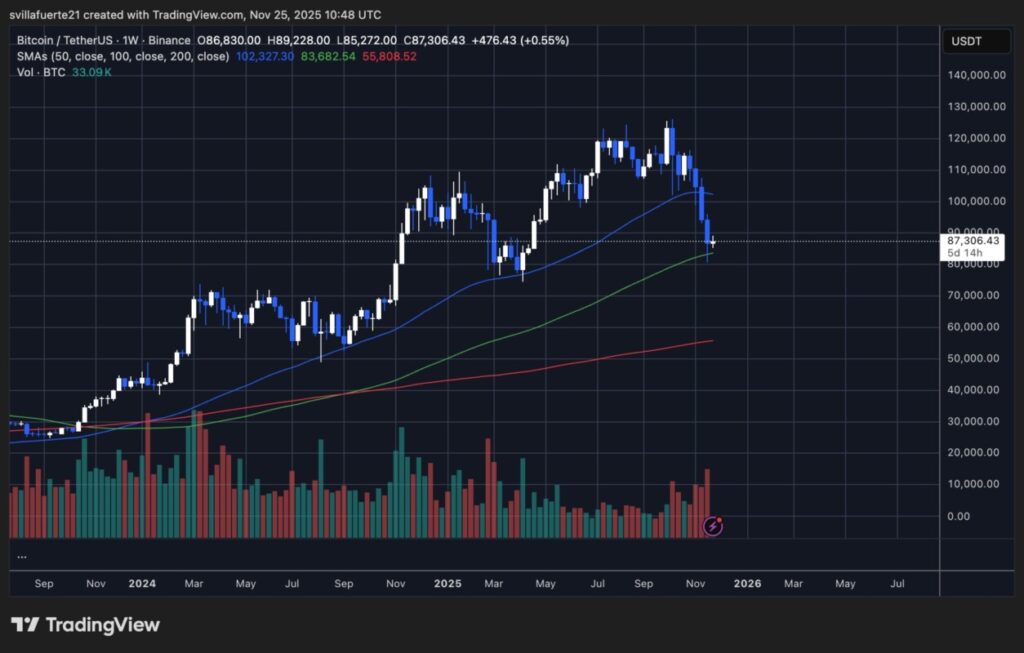
Bitcoin’s weekly chart shows a market that is trying to stabilize after a sharp decline from a record high near $126,000. The price is currently trading around $87,300, reflecting a significant drop of more than 30% from its peak. The latest candle structure highlights a temporary rebound after touching a low near $80,000, suggesting that buyers have entered at a critical support zone.
The 100-week moving average, which sits close to current levels, acts as important dynamic support and has historically served as a threshold separating bullish continuation from deeper cyclical declines. Despite the bounce, the price is still below the 50-week moving average, which has started to curve downwards, signaling a weakening of the trend strength.
Is Bitcoin Ready for Recovery?
If Bitcoin can maintain support above this zone and reclaim the 50-week moving average, a recovery towards the $95,000-$102,000 range becomes possible. However, if the selling pressure continues and the price loses the 100-week moving average, the next downside magnet lies in the $75,000-$78,000 range. The weekly structure shows a market in correction but not yet in confirmed macro reversal, with upcoming candles likely to determine whether the cycle continues or breaks down further.
Also Read: A Complete Guide to Saving Digital Gold in 2025 – Simple, Safe, Can Start from Rp11,000!
Follow us on Google News to get the latest information about crypto and blockchain technology. Check Bitcoin price today, Solana price today, Pepe coin and other crypto asset prices through Pintu Market.
Enjoy an easy and secure crypto trading experience by downloading Pintu crypto app via Google Play Store or App Store now. Also, get a web trading experience with various advanced trading tools such as pro charting, various types of order types, and portfolio tracker only at Pintu Pro.
*Disclaimer
This content aims to enrich readers’ information. Pintu collects this information from various relevant sources and is not influenced by outside parties. Note that an asset’s past performance does not determine its projected future performance. Crypto trading activities are subject to high risk and volatility, always do your own research and use cold hard cash before investing. All activities of buying andselling Bitcoin and other crypto asset investments are the responsibility of the reader.
FAQ
Q1: What is the Bitcoin Bull-Bear Structure Index?
A1: The Bitcoin Bull-Bear Structure Index is an analytical tool used to measure the strength of a bullish or bearish market based on trading and derivatives data.
Q2: Who is Axel Adler?
A2: Axel Adler is a leading analyst who often provides insights into the market dynamics of Bitcoin and other cryptocurrencies.
Q3: What is Bitcoin fair value?
A3: The fair value of Bitcoin is an estimated price based on an analysis of derivative positions and other market factors, which is considered a ‘fair’ price for Bitcoin at any given time.
Q4: What is the 100-week moving average?
A4: The 100-week moving average is a metric that calculates the average closing price of Bitcoin over the last 100 weeks, often used as a support or resistance indicator in technical analysis.
Q5: What is the current state of the Bitcoin market?
A5: Currently, the Bitcoin market is undergoing a correction with some indicators showing the potential for stabilization and recovery, although there is still a risk of further decline.
Reference
- Bitcoinist. Bitcoin Bull Bear Index Shows Bear Pressure Easing. Accessed on November 26, 2025