XRP Enters Tight Consolidation Phase as It Gears Up for Wave 3 Rally
Jakarta, Pintu News – XRP spent another week in a narrow trading range, with prices continuing to move around the $2.08 level without showing any significant upward or downward movement.
TARA analysts revealed a new wave structure that could determine the direction in which XRP moves through 2025.
XRP Still Waiting for Momentum
TARA set the next target for Wave 3 at $2.73, but emphasized that before reaching that level, XRP must first break two important resistance levels at $2.18 and $2.30.
Read also: Shiba Inu Price Prediction: Whale Activity Soars, Burn Rate Up 248%!
Both levels have stalled the price’s upside attempts several times, and if they are broken cleanly, it could signal the beginning of a stronger impulsive move.
TARA also adds that support at $2.07 is still quite strong, although the possibility of retesting this level remains. He expects the targets for the 4th and 5th Waves to shift slightly once confirmation of the 3rd Wave is achieved.
Overall, TARA’s view reflects the broader market situation, where XRP is still waiting for the right momentum or trigger to confirm a new phase of price gains.
Weekly charts show pressure from sellers persists
On the weekly chart, XRP is still in a prolonged consolidation phase. The price of XRP remains below a number of marked Fibonacci levels from previous price movements – namely around the 0.618, 1.0, and 1.618 levels. This indicates that the asset needs stronger buying pressure for the price to start rising.

The Relative Strength Index (RSI) indicator is giving a cautionary signal. It is currently hovering around 41, lower than the neutral 50. This suggests that buyers have not really taken control of the market. The RSI has also been consistently declining since the middle of this year, just after reaching a local peak, signaling a decline in demand.
Meanwhile, the RSI signal line is at 47.70, which is still higher than the current RSI value. This indicates that selling pressure (bearish) is still dominating the current market phase.
XRP Struggles to Break $3 Level on Higher Timeframes
On the weekly chart, the MACD indicator is also showing a bearish signal. The MACD line is at around -0.105, with a considerable negative difference to the signal line which is at around -0.007.
The red histogram bars are lengthening again after slowing down in late summer. This is an indication that buying momentum continues to weaken. There is currently no bullish crossover that could signal an upward trend reversal.
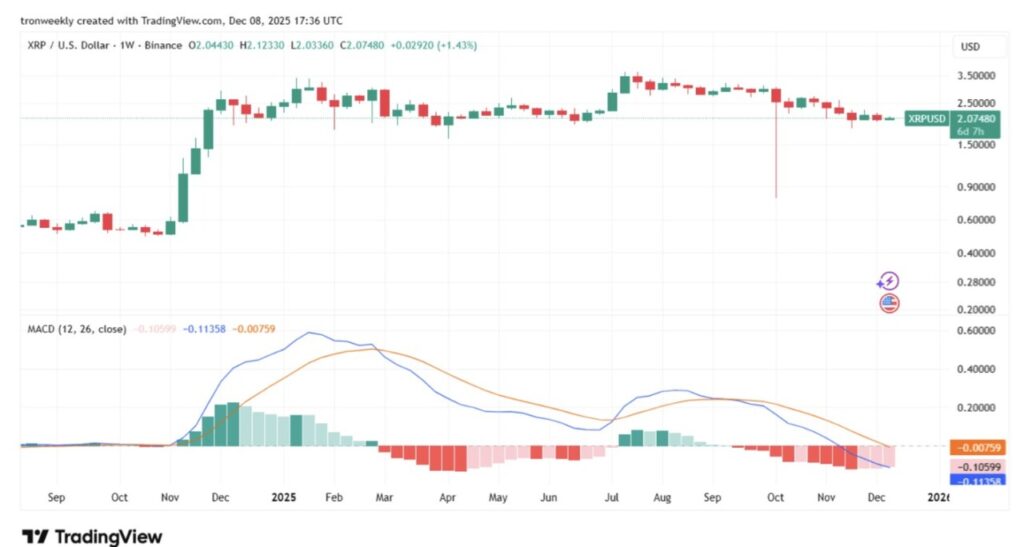
XRP price is still stuck below the $3 level, which is an important psychological level and coincides with a number of key Fibonacci extension levels. Without a strong weekly closing pattern above this area, any attempt at a price increase is likely to be resisted.
Meanwhile, the zone between $1.70 to $1.90 is still a solid accumulation and support region. However, in the absence of strong catalysts, XRP price is expected to remain stable and needs a significant push to break through higher resistance levels.
That’s the latest information about crypto. Follow us on Google News to get the latest crypto news about crypto projects and blockchain technology. Also, learn crypto from scratch with complete discussion through Pintu Academy and stay up-to-date with the latest crypto market such as bitcoin price today, xrp coin price today, dogecoin and other crypto asset prices through Pintu Market.
Enjoy an easy and secure crypto trading experience by downloading Pintu crypto app via Google Play Store or App Store now. Also, get a web trading experience with various advanced trading tools such as pro charting, various types of order types, and portfolio tracker only at Pintu Pro.
*Disclaimer
This content aims to enrich readers’ information. Pintu collects this information from various relevant sources and is not influenced by outside parties. Note that an asset’s past performance does not determine its projected future performance. Crypto trading activities have high risk and volatility, always do your own research and use cold cash before investing. All activities of buying and selling bitcoin and other crypto asset investments are the responsibility of the reader.
Reference:
- TronWeekly. XRP Weekly Chart Signals Tight Consolidation Ahead of Wave 3 Target. Accessed on December 10, 2025


