Dogecoin Dips 4% Today: Is DOGE Still Stuck in a Bearish Trend?

Jakarta, Pintu News – Dogecoin’s price on December 15 was hovering around $0.1367 after a steady decline in line with Bitcoin , as traders reduced their risk exposure in the crypto market.
This movement keeps the DOGE stuck near an important short-term support zone after last week’s decline. Currently, sellers still dominate the overall market structure, while buyers look to stabilize the momentum.
Then, how will the Dogecoin price move today?
Dogecoin Price Drops 4.34% in 24 Hours
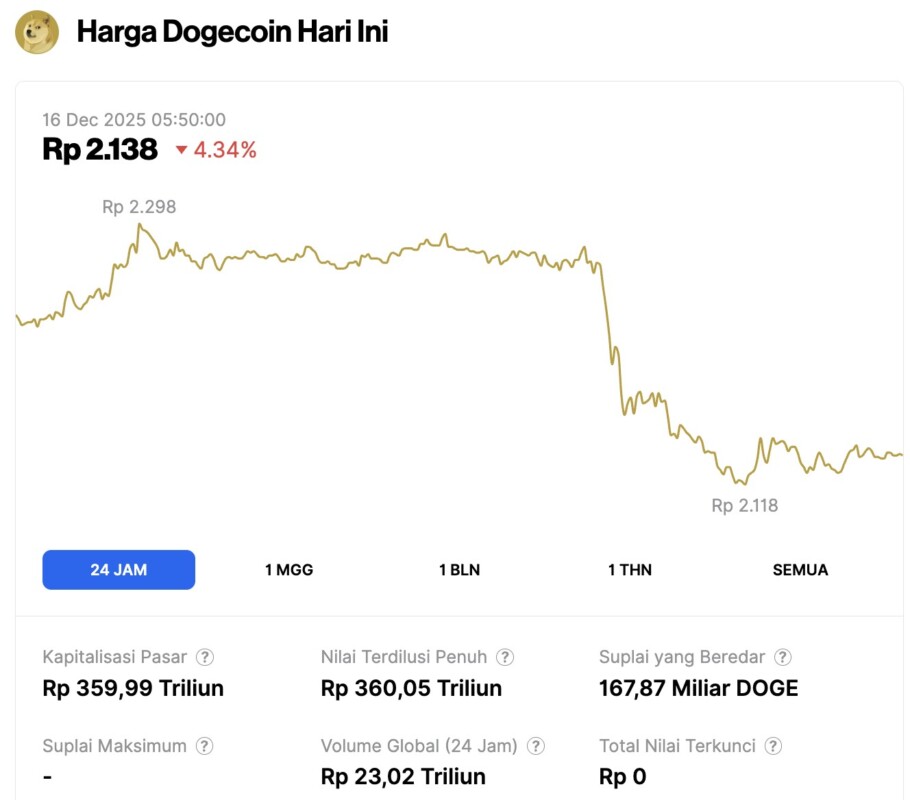
On December 16, 2025, Dogecoin experienced a 4.34% decline within 24 hours, bringing its price down to $0.1285, or approximately IDR 2,138. During that 24-hour window, DOGE traded within a range of IDR 2,298 to IDR 2,118.
At the time of writing, Dogecoin’s market capitalization is estimated at around IDR 359.99 trillion, with a 24-hour trading volume of approximately IDR 23.02 trillion.
Read also: Bitcoin Price Plunges to $86,000 Today: Can BTC Recover?
Macro shocks push Memecoin into survival mode
The latest drop in the price of memecoins came as a result of a change in sentiment triggered by macro factors, following the Federal Reserve’s decision to cut interest rates by 25 basis points.
Although this decision was expected, divergent views among policymakers and renewed concerns about inflation triggered risk-off in various asset classes.
Bitcoin’s drop below $90,000 over the weekend further pressured the high-beta segment of the market. Memecoin performed poorly, with Dogecoin experiencing more immediate selling pressure despite no specific negative news regarding DOGE.
These movements reflect position adjustments rather than fundamental factors, as traders reduce exposure amid heightened volatility.
This context is important: Dogecoin’s weakness is part of a broader de-risking cycle, not just a standalone price drop.
Trend Structure Still Bearish in Daily Charts
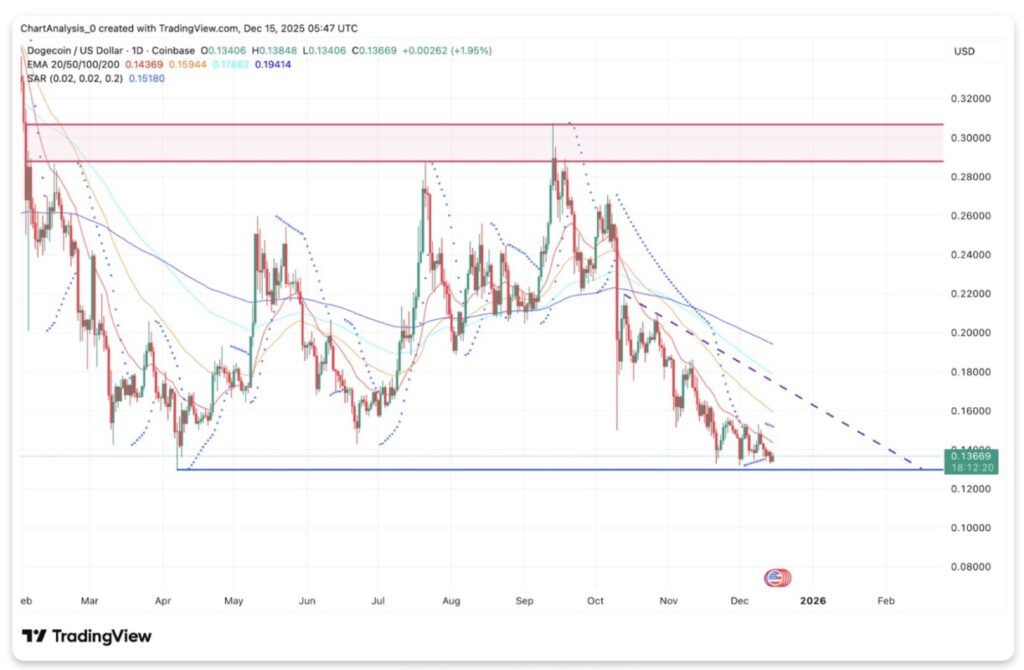
On the daily chart (15/12), DOGE is still following a clear downward pattern since its October peak near $0.31. Every recovery attempt in the past two months has always failed to break the downside resistance, further reinforcing the sellers’ dominance.
The price of DOGE remains below all major moving averages. The 20-day EMA is around $0.144, followed by the 50-day EMA around $0.159. The 100-day and 200-day EMAs are well above, at $0.179 and $0.194 respectively. This arrangement of EMAs limits the upside potential of the price and confirms the bearish trend in the medium term.
Read also: Ethereum Drops to $2,900 as Whale Scoops Up $119 Million Worth of ETH
The Parabolic SAR indicator is also above the current price, which suggests the downward pressure is still strong. As long as DOGE has not been able to break back through the 20-day EMA, any price bounce is still considered structurally weak.
The support zone is now quite tight. The $0.137 to $0.135 area is the closest demand zone. This level corresponds to the low of the last session and also the base of the previous consolidation from early April.
If DOGE breaks this level convincingly, it will open a path towards the psychological level of $0.130, and potentially even a deeper drop to $0.120 if selling pressure increases.
Intraday Signals Point to Potential Short-Term Stabilization
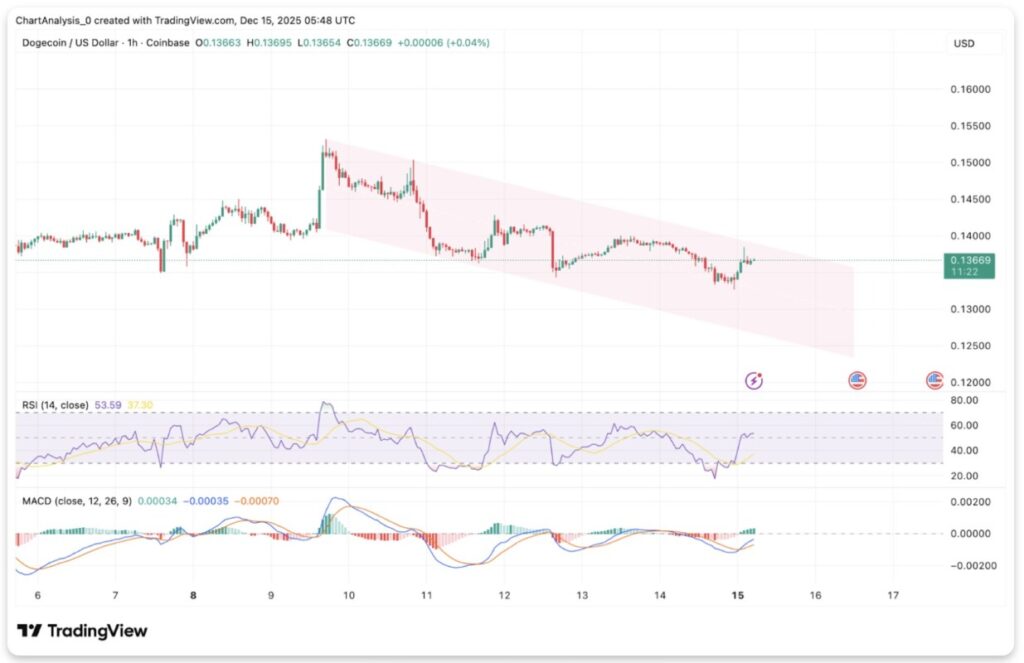
In the shorter timeframes, the downward momentum seems to be slowing down – although it hasn’t really reversed yet. On the one-hour chart (15/12), DOGE is still moving within a descending channel, but selling pressure has started to ease near the lower boundary of the channel.
The RSI indicator has recovered from oversold conditions and is now in the low to mid 50s range, indicating a stabilization phase instead of bullish strength. The MACD also shows a slight upward crossover, but remains near the zero line, reflecting weak upside conviction.
These signals are more indicative of downtrend exhaustion than active accumulation. The buyers are seen defending the support zone, but have not been able to push the price out of the downward pattern.
To strengthen intraday momentum, DOGE needs to move consistently above the $0.140 level. This level is the midpoint of the current price range as well as the first short-term resistance area. If it fails to break it, the price is still vulnerable to retest the previous low.
On-Chain Data Shows Mixed Picture
On-chain indicators provide additional nuances to technical analysis. The Network Value to Transaction (NVT) ratio fell by about 14% in the last three months, indicating an increase in transaction activity relative to market value. Historically, this kind of decline often precedes an asset undervaluation phase.
However, October data showed a spike in NVT to a three-month high around 93.4, signaling a temporary mismatch between network value and transaction demand. This divergence reflects Dogecoin’s volatility more than confirmation of a trend change.
The Market Value to Realized Value (MVRV) ratio also remains low, with more and more addresses incurring losses. While reflecting the ongoing bearish sentiment and distribution, this has previously been a contrarian signal after the capitulation phase subsided.
Also read: Meme Coin is Not Dead, MoonPay President Says Meme Coin is Ready to Return in a Different Form
Whale behavior also reflects uncertainty. Some large holders have reduced exposure since October, while others have aggressively accumulated in recent weeks.
In particular, there was a transfer of 352 million DOGE from Bybit to an unknown wallet, indicating selective accumulation behind the scenes-although it has yet to have a direct impact on price appreciation.
Outlook: Will Dogecoin Price Rise?
Bullish (Optimistic) Scenario:
If Dogecoin is able to hold the support level at $0.137 and then manages to reclaim $0.144, this would be a signal of short-term stabilization. A daily close above the 20-day EMA would open up opportunities for a recovery towards $0.159, where there is a 50-day EMA as the next resistance.
Bearish (Pessimistic) Scenario:
On the contrary, if DOGE breaks the $0.135 level decisively, it will confirm the continuation of the descending channel pattern. This move risks bringing the price down to $0.130, and even towards $0.120 if the market sentiment remains dominated by risk-off.
That’s the latest information about crypto. Follow us on Google News to get the latest crypto news about crypto projects and blockchain technology. Also, learn crypto from scratch with complete discussion through Pintu Academy and stay up-to-date with the latest crypto market such as bitcoin price today, xrp coin price today, dogecoin and other crypto asset prices through Pintu Market.
Enjoy an easy and secure crypto trading experience by downloading Pintu crypto app via Google Play Store or App Store now. Also, get a web trading experience with various advanced trading tools such as pro charting, various types of order types, and portfolio tracker only at Pintu Pro.
*Disclaimer
This content aims to enrich readers’ information. Pintu collects this information from various relevant sources and is not influenced by outside parties. Note that an asset’s past performance does not determine its projected future performance. Trading crypto carries high risk and volatility, always do your own research and use cold hard cash before investing. All activities of buying and selling bitcoin and other crypto asset investments are the responsibility of the reader.
Reference:
- CoinEdition. Dogecoin Price Prediction: Descending Channel Keeps Pressure On As Buyers Defend $0.137. Accessed on December 16, 2025


