Bitcoin Price Decline: Will Support Be Threatened in December 2025?

Jakarta, Pintu News – Bitcoin recently tried to increase its value but failed to break the $90,000 resistance. Currently, Bitcoin is in a consolidation phase and seems to be struggling to cross the $88,000 zone.
Bitcoin Loss Consolidation
Bitcoin tried to surge above $88,000 and $88,500, but after reaching the $90,000 resistance zone, the price experienced a sharp decline. This decline included losing support from the bullish trend line present at $86,450 on the hourly chart of the BTC/USD pair.
The price even briefly dropped below the $86,000 support, but buyers became active in the $85,250 zone, where the lowest price was recorded at $85,282 before the price started to correct upwards. There was a rise above the 23.6% Fibonacci retracement level of the move down from $90,318 to $85,282. However, sellers are still active near $87,000, and Bitcoin is currently trading below $87,000 as well as below the 100-hour simple moving average.
Also Read: How Crypto is Remaking the Financial System, AI, and Privacy Until 2026 According to a16z Crypto
Potential Increase in Bitcoin Price
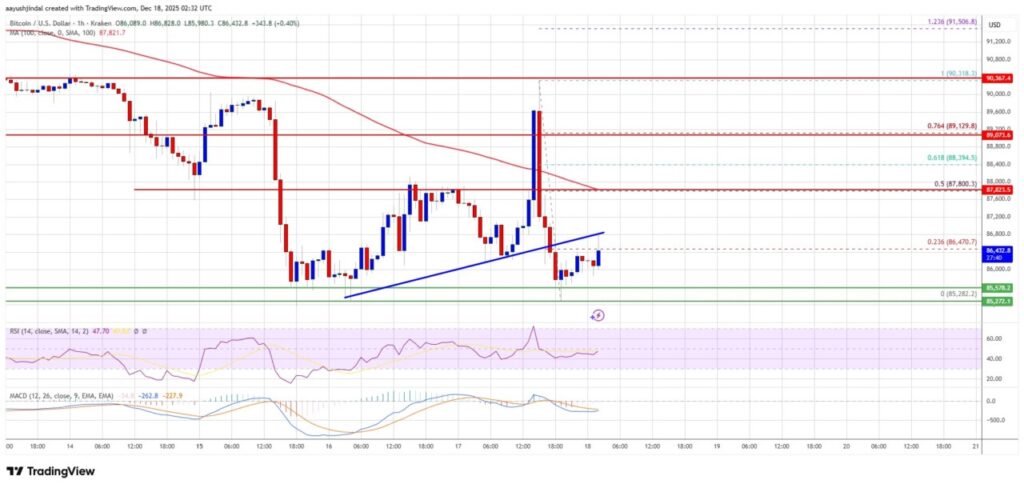
If buyers continue to be active, there is a chance that Bitcoin will try to climb higher. Immediate resistance is near the $86,800 level, with the first key resistance at $87,350. The next resistance may be at $87,800 or at the 50% Fibonacci retracement level of the move down from $90,318 to $85,282. A close above the $87,800 resistance could push the price even higher, possibly reaching $88,000 and if it continues to rise, it could reach $89,200. The next limits for the buyers are $90,000 and $90,500.
Possible Bitcoin Price Drop
If Bitcoin fails to rise above the $87,800 resistance zone, the price could drop again. Immediate support is near $85,500, with the first major support at $85,250. The next support is at the $85,000 zone. If the losses continue, the price could head to $84,200 support in the near term.
Key support is at $83,500, below which Bitcoin may experience a faster decline. Technical indicators: – MACD hourly – MACD is currently losing momentum in the bearish zone. – Hourly RSI (Relative Strength Index) – The RSI for BTC/USD is currently below the 50 level.
The Future of Bitcoin
With continued bearish pressure and an inability to sustain gains, Bitcoin’s future looks to be fraught with challenges. Investors and market watchers should continue to monitor technical indicators and key support levels in anticipation of further price movements.
Also Read: 7 XRP Facts on Institutional Finance via VivoPower’s $900 Million Exposure Structure
Follow us on Google News to get the latest information about crypto and blockchain technology. Check Bitcoin price today, Solana price today, Pepe coin and other crypto asset prices through Pintu Market.
Enjoy an easy and secure crypto trading experience by downloading Pintu crypto app via Google Play Store or App Store now. Also, get a web trading experience with various advanced trading tools such as pro charting, various types of order types, and portfolio tracker only at Pintu Pro.
*Disclaimer
This content aims to enrich readers’ information. Pintu collects this information from various relevant sources and is not influenced by outside parties. Note that an asset’s past performance does not determine its projected future performance. Crypto trading activities are subject to high risk and volatility, always do your own research and use cold hard cash before investing. All activities of buying andselling Bitcoin and other crypto asset investments are the responsibility of the reader.
FAQ
Q1: What caused the recent Bitcoin price drop?
A1: Bitcoin’s price drop was caused by the failure to break the $90,000 resistance, which triggered selling and a drop below important support.
Q2: Where are Bitcoin’s main support levels right now?
A2: Bitcoin’s current major support level is $85,250, followed by $85,000 and $84,200 as further support.
Q3: What are the technical indicators that point to a bearish trend for Bitcoin?
A3: The hourly MACD indicator shows a loss of momentum in the bearish zone and the hourly RSI is below the 50 level, both indicating a bearish trend.
Q4: What is the key resistance to watch if Bitcoin price starts to rise?
A4: The key resistance to watch is $86,800, followed by $87,350 and $87,800. A close above these might push the price to higher levels.
Q5: What are the consequences if Bitcoin continues to fall below $83,500?
A5: If Bitcoin continues to fall below $83,500, it could trigger a faster and deeper decline, affecting overall market sentiment.
Reference
- NewsBTC. Bitcoin Price Rejection at $90K. Accessed on December 19, 2025