7 SHIB Crypto Facts: Golden Cross Hours, Moderate Rebound & Sell-Off Barriers

Jakarta, Pintu News – Price analysis of the Shiba Inu cryptocurrency on December 22, 2025 shows that the meme coin is on the verge of forming a golden cross on thehourly chart, a technical signal often observed by market participants to assess the potential for short-term breakouts.
Although SHIB prices showed a small rebound, structural obstacles such as strong selling pressure and inconsistent burn activity remain a challenge for continued movement. This data comes from a U.Today report that looks at the movement of technical indicators and market volume of SHIB.
1. SHIB Approaches Golden Cross on Hourly Chart
On the hourly chart, Shiba Inu is close to completing a golden cross, which is when the short-term moving average (9-day MA) rises through the long-term moving average (26-day MA), with a critical point around $0.000007271 being the anticipated level for the signal. This position is often seen as an indication of short-term momentum turning towards the positive, although its validity needs further confirmation.
As contextual data, at the time of the report the price of SHIB is hovering around $0.000007328, reflecting a gain of around 0.38% in the last 24 hours from broader bearish pressure below the $0.00001 level.
Also Read: 7 XRP vs BNB Facts: Tight Competition for Top-3 Market-Watched Crypto Positions
2. Technical Interpretation of Golden Cross
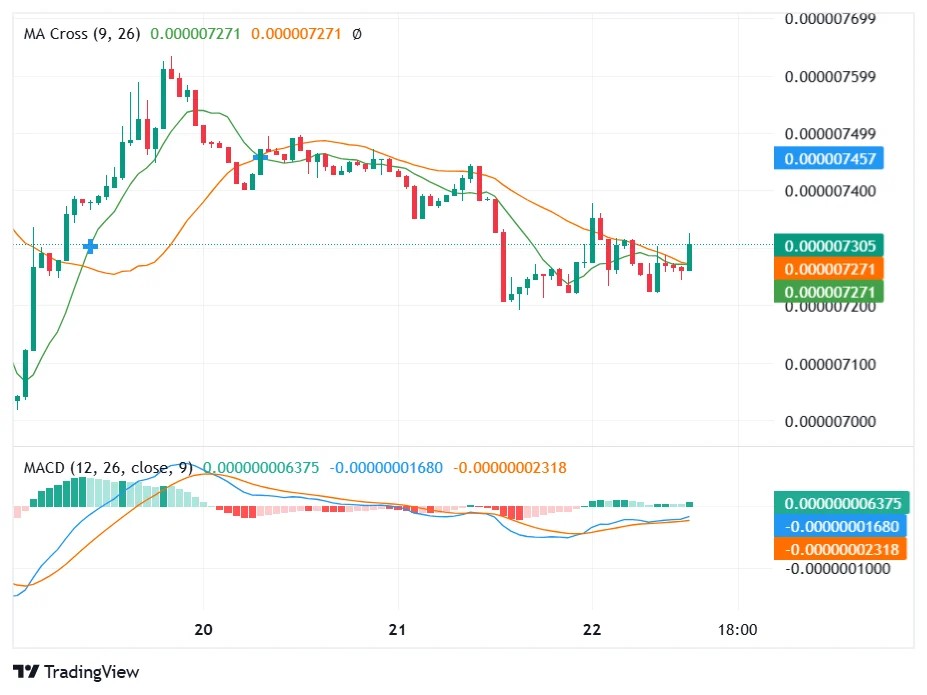
The golden cross pattern occurs when the short-term MA crosses the long-term MA from bottom to top, and technically is often viewed as an early signal of upward momentum if followed by further confirmation. This structure provides context that if the MA convergence materializes, SHIB’s price activity could signal an early short-term change in direction.
However, technical observers note that golden crosses on higher timeframes (e.g. daily) tend to signal more strongly than on hourly timeframes, so interpretation should consider the broader context of the long-term trend.
3. Relatively Small Price Rebound
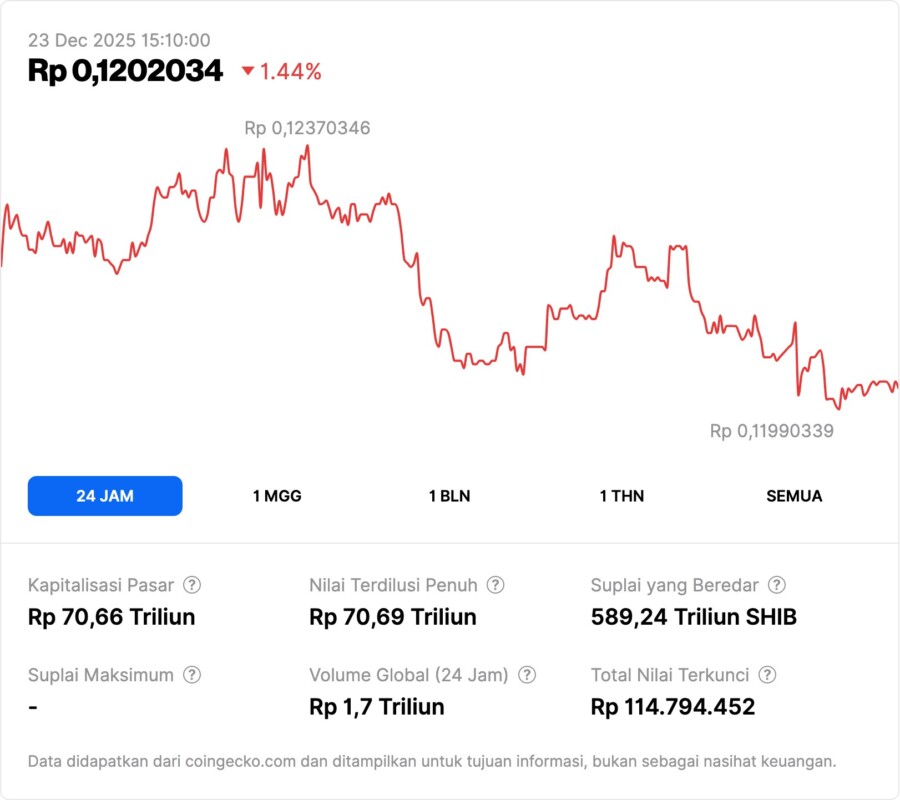
SHIB’s price rebound has been moderate so far and has yet to break larger structural barriers; general downward market volatility has pushed the price of this meme coin below psychologically important levels such as $0.00001. These price conditions suggest that despite positive technical indications, the upward momentum is not yet fully established.
SHIB’s trading volume also increased by approximately 33.47% to approximately $93.52 million, but the increase in volume was not enough to overcome the dominance of the remaining selling pressure.
4. Technical Barriers: Sell-Off Pressure
SHIB’s deflationary burn mechanism, intended to reduce circulating supply, is still not consistent enough to trigger a sustained rebound. Although a number of SHIB tokens were sent todead wallets, this activity has not been significant in the context of broader market demand.
The selling pressure continues to be affected by the actions of holders who unwind positions to reduce losses, reflecting the dynamics of a fairly strong selling pressure in the meme coin market during this bearish period.
5. Market Engagement & Volume
The surge in market volume over a short period could be an indication that interest in SHIB is returning after a period of low volatility, but volumes need to remain high to support prices to break through important technical levels higher and maintain rebound momentum.
The more active trading volume also provides context that some traders are starting to react to technical signals such as the golden cross on shorter timeframes, but the impact on longer-term prices still needs further observation.
6. The Context of Crypto Market Volatility
In general, the cryptocurrency market remains highly volatile due to external macro factors and global market sentiment. In this environment, technical patterns such as golden crosses may appear temporarily but may not necessarily trigger a sustained trend change without stronger fundamental support.
Therefore, continued observation of volume, support & resistance, and technical patterns on higher timeframes is important to see if these signals actually contributed to the SHIB crypto price breakout.
7. SHIB Price Outlook Going Forward
If the golden cross on the hourly timeframe is confirmed and followed by strong buying volume, this could be an early signal of a short-term rebound. But without sustained momentum or breakouts on higher timeframes, SHIB prices are likely to remain in a consolidation phase until a new stronger technical or fundamental push occurs.
Follow us on Google News to get the latest information about crypto and blockchain technology. Check Bitcoin price today, Solana price today, Pepe coin and other crypto asset prices through Pintu Market.
Enjoy an easy and secure crypto trading experience by downloading Pintu crypto app via Google Play Store or App Store now. Also, get a web trading experience with various advanced trading tools such as pro charting, various types of order types, and portfolio tracker only at Pintu Pro.
*Disclaimer
This content aims to enrich readers’ information. Pintu collects this information from various relevant sources and is not influenced by outside parties. Note that an asset’s past performance does not determine its projected future performance. Crypto trading activities are subject to high risk and volatility, always do your own research and use cold hard cash before investing. All activities of buying andselling Bitcoin and other crypto asset investments are the responsibility of the reader.
FAQ
What is a golden cross on the SHIB chart?
A golden cross is a technical signal that occurs when the short-term moving average crosses the long-term moving average from bottom to top, indicating a short-term change in momentum.
At what level is the SHIB golden cross happening?
On the hourly chart, SHIB’s golden cross is heading around the $0.000007271 level as the MA intersection point.
How much will SHIB cost when this analysis is released?
SHIB was trading at approximately $0.000007328 at the time of this report.
Why hasn’t SHIB burn affected prices yet?
While some SHIB tokens have been burned, the inconsistent burn activity has not been large enough to withstand the selling pressure and prompt a sustained price rebound.
Does the golden cross mean SHIB will go up big fast?
Not automatic. A golden cross may indicate short-term bullish momentum, but without high volume and confirmation from higher timeframes, it does not guarantee a strong breakout.
Reference:
Godfrey Benjamin/U.Today. Shiba Inu Price Eyes Breakout Ahead of Hourly Golden Cross Setup. Accessed December 22, 2025.