3 Cryptos Whales Are Buying — and Selling — Ahead of the US CPI Report
Jakarta, Pintu News – The US CPI (Consumer Price Index) print for January is about to be released at a sensitive moment for the market, and the “crypto whales” (owners of large amounts of crypto assets) have already started taking positions.
Inflation is expected to remain stable, in line with November data that showed easing. However, inflation is still high enough to keep expectations of a rate cut in early 2026 low. The weaker November CPI was not enough to change expectations for Fed policy, so liquidity conditions are still tight.
In this situation, the behavior of the whales becomes more important than just price movements. When optimism about interest rate cuts is low, large holders tend to act more selectively and risk less.
Ahead of the CPI release, on-chain data showed a clear divergence across the three tokens: whales were seen accumulating two tokens, while reducing exposure to the third after the recent price rally.
Maple Finance (SYRUP)
Among several tokens targeted for accumulation by crypto whales ahead of the CPI data release, Maple Finance stands out as a bet that focuses more on the DeFi sector than macroeconomic speculation.
Read also: Bitcoin Surges to 50-Day High as US-Iran War Risk Increases!
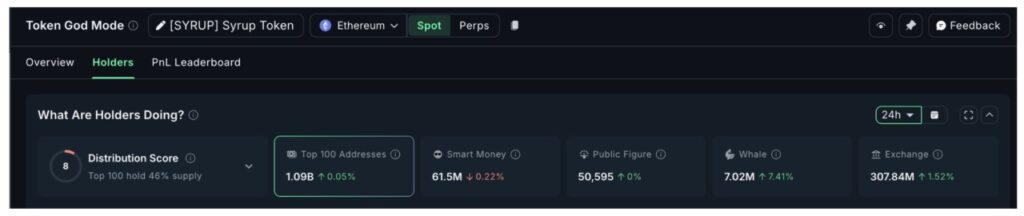
On January 13, whale wallet holding Maple Finance recorded a 7.41% increase in its holdings, equivalent to the addition of approximately 480,000 SYRUP tokens, worth approximately $190,000 based on current prices. At first glance, this daily increase may seem mundane. However, the long-term context gives it greater significance.
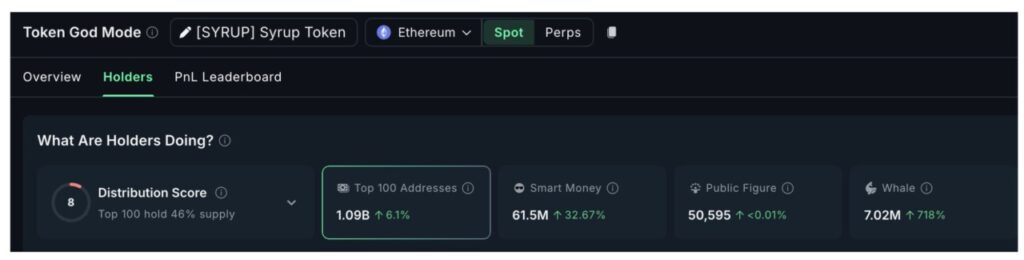
In the past 30-day period, whale ownership of Maple Finance surged by more than 718%, indicating steady and consistent accumulation, not just reactive buying.
The price movement supports this pattern. SYRUP’s price increased by almost 40% over the past 30 days, from around $0.23 to $0.40 since early December. This rise is supported by technical trend signals on the price chart.
One such indicator is the EMA (Exponential Moving Average) – an indicator that gives more weight to recent prices to determine trend direction. On SYRUP’s daily chart, the 20-day EMA has broken above the 50- and 100-day EMAs, a pattern that generally signals stronger upward momentum.
Currently, the price is trading above all major EMAs, reinforcing the bullish trend. Additionally, the 20-day EMA is also nearing a crossover with the 200-day EMA, which could be an additional bullish signal.
The next challenge is at the $0.40 level, which was previously a strong resistance and briefly rejected the price on January 12. If price manages to close the day above this level (about a 3.8% increase from where it currently stands), then there is potential to head towards $0.46, even $0.50 if momentum continues.
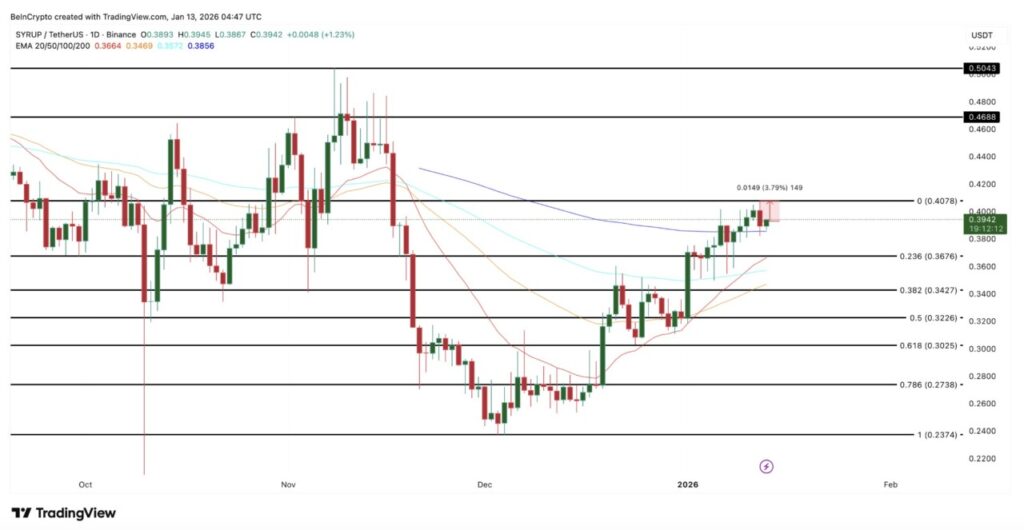
The downside risks remain manageable, but clear. If the price drops below $0.36, it could be an early warning sign. A deeper drop below $0.34 would bring the price back below the important EMA, weakening the bullish structure and opening a chance for a correction towards $0.30.
Chainlink (LINK)
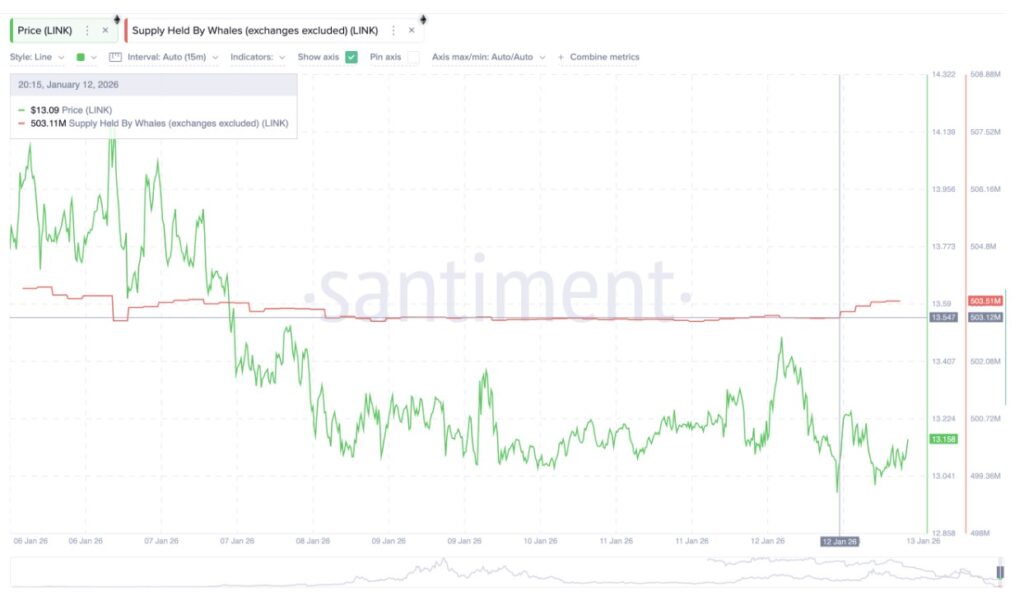
Ahead of the US CPI data release, Chainlink showed a quiet accumulation pattern from the whales, signaling a selective buying strategy instead of broad speculative action.
On January 13, crypto whale wallets recorded an increase in LINK holdings from 503.12 million to 503.51 million, equivalent to an additional approximately 390,000 LINKs or approximately $6.6 million worth. This is quite significant, given that expectations of a rate cut as early as 2026 are still low – conditions that usually restrain aggressive buying.
However, whales seem to be starting to gravitate towards infrastructure projects like Chainlink, which ties into the real-world asset (RWA) narrative – a theme that continues to be strong throughout 2025 and into 2026.
LINK’s price structure favors this accumulation. Chainlink is currently forming a double bottom pattern on the 12-hour chart – a “W” shaped pattern that usually signals the exhaustion of selling pressure.
The price has stabilized after forming a second lower low, and is now slowly moving up. To strengthen this momentum, LINK needs to break the $13.50 level first, then $14.90, which has been a strong resistance several times.
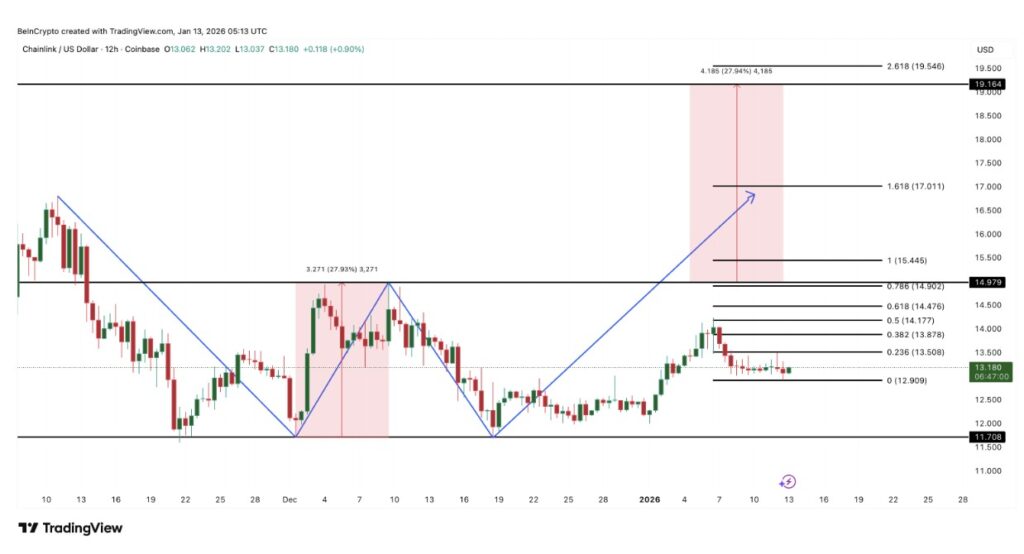
If it manages to break $14.90 on a net basis on the 12-hour chart, it opens up a path towards $15.50 and $17.01, it could even test higher resistance around $19.56 if momentum continues.
Read also: 36 Altcoins Worth Considering in the First Quarter of 2026, According to Grayscale
Downside risks are also clear and defined. A drop below $12.90 will weaken the current recovery structure. If the price drops deeper to below $11.70, then the double bottom structure is considered to have failed, and the uptrend potential will be drastically weakened.
Polygon (POL)
Polygon ecosystem token experienced a significant shift in whale behavior just ahead of the US CPI data release. Although POL still recorded a gain of about 20% on the week, the token experienced a drop of almost 4% on January 13.
During this phase of falling prices, large crypto whales holding between 10 million and 100 million POL started to reduce exposure, having previously increased holdings between January 10-12. In the past day, this group reduced holdings from 585.39 million to 582.37 million POL, or about 3.02 million tokens.
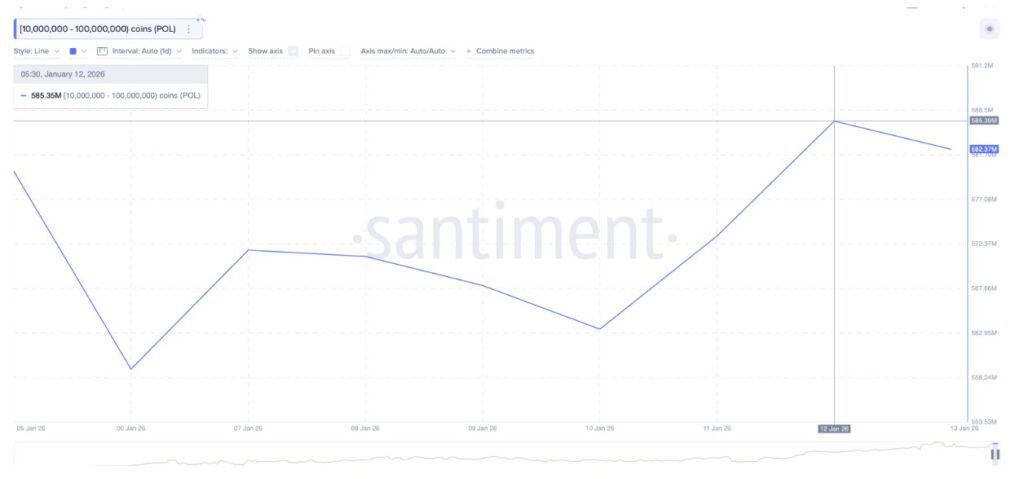
The timing of this sale is noteworthy, as it comes after several consecutive days of price rallies.
POL’s price structure speaks to this caution. Since early January, POL has risen sharply from its low, forming a steep pole pattern, followed by a tight consolidation phase that resembles a bullish flag – a technical pattern that usually signals a potential continuation of the uptrend.
However, the decline from the highs was aggressive rather than restrained. At the same time, the On-Balance Volume (OBV) indicator – which measures whether the volume supports the price direction – starts to decline and approaches its uptrend line.
This indicates that the buying pressure is starting to weaken, although the price is still trying to stay within the consolidation range. If the OBV trendline is broken, the bullish structure could weaken further.
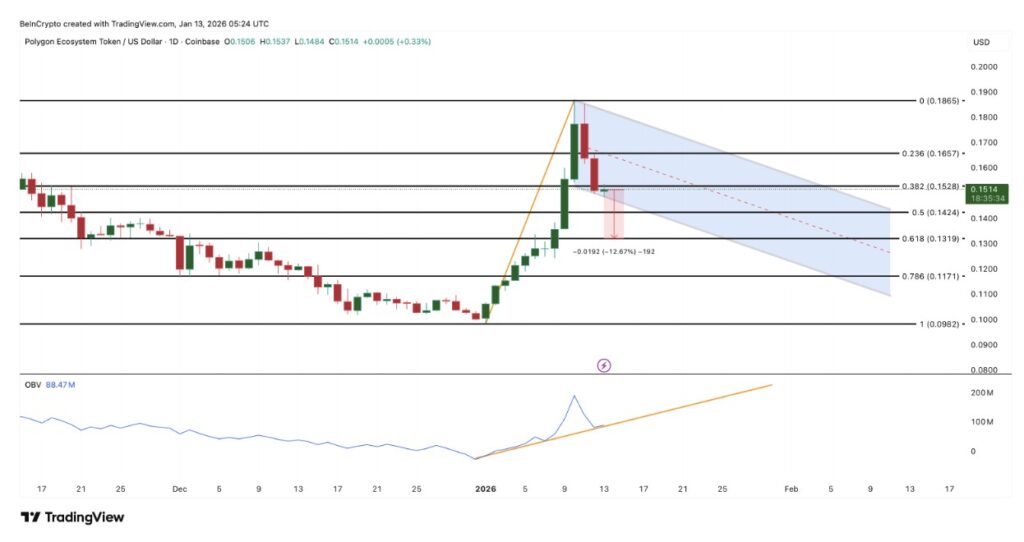
If POL loses support at $0.14 and then $0.13, then the bullish flag pattern risks a confirmed failure, opening up the potential for a further drop to $0.11, even $0.09. Conversely, the continuation of the uptrend will only be valid again if the price manages to break $0.16, supported by increased trading volume.
For now, the whale sell-off suggests that POL’s recent price movements appear more cyclical than long-term conviction-based – especially ahead of important macro events such as the CPI data release.
That’s the latest information about crypto. Follow us on Google News to get the latest crypto news about crypto projects and blockchain technology. Also, learn crypto from scratch with complete discussion through Pintu Academy and stay up-to-date with the latest crypto market such as bitcoin price today, xrp coin price today, dogecoin and other crypto asset prices through Pintu Market.
Enjoy an easy and secure crypto trading experience by downloading Pintu crypto app via Google Play Store or App Store now. Also, get a web trading experience with various advanced trading tools such as pro charting, various types of order types, and portfolio tracker only at Pintu Pro.
*Disclaimer
This content aims to enrich readers’ information. Pintu collects this information from various relevant sources and is not influenced by outside parties. Note that an asset’s past performance does not determine its projected future performance. Crypto trading activities have high risk and volatility, always do your own research and use cold cash before investing. All activities of buying and selling bitcoin and other crypto asset investments are the responsibility of the reader.
Reference:
- BeInCrypto. What Crypto Whales Are Buying and Selling Ahead Of The January US CPI Print. Accessed on January 15, 2026


