Ethereum Reclaims the $3,000 Level as Whales Scoop Up $360 Million Worth of ETH

Jakarta, Pintu News – Ethereum price fell nearly 6% on January 21 (24 hours) and about 13% in two days, extending a volatile downward trend throughout January. The price briefly fell below important levels, raising fresh doubts whether buyers can regain control of the market.
But behind the movement, large holders went on a massive buying spree. Around $360 million ETH was bought by whales as the price neared the bottom. The chances of a rebound look tempting, but experienced traders (smart money) are still not entirely convinced.
Then, how is Ethereum’s current price movement?
Ethereum Price Up 0.57% in 24 Hours
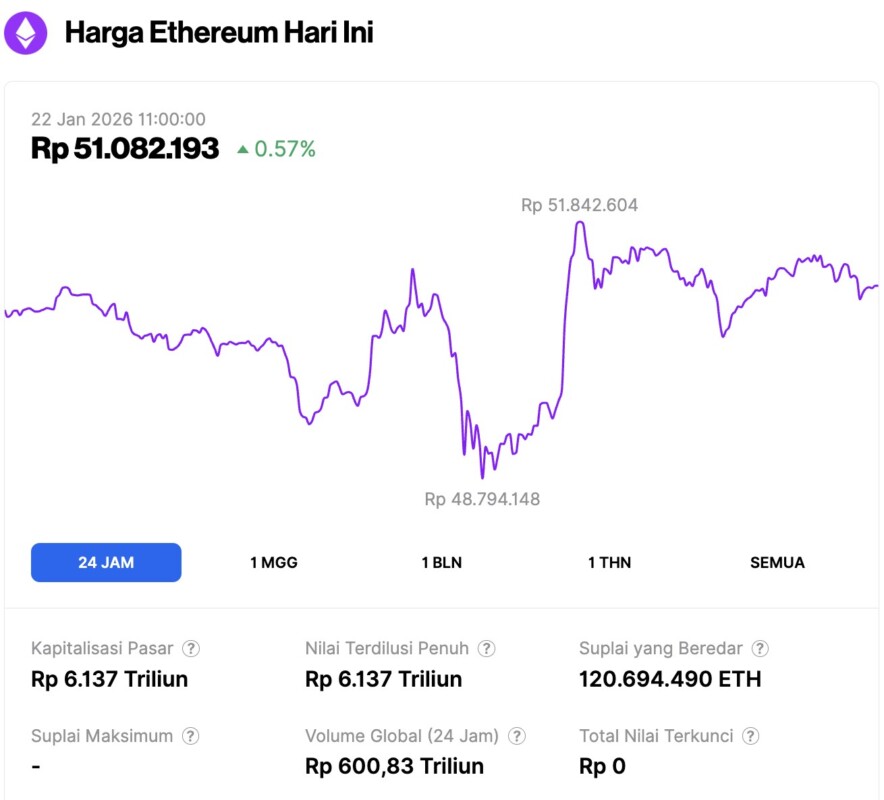
On January 22, 2026, Ethereum was trading at approximately $3,010, or around IDR 51,082,193 — marking a 0.57% increase over the past 24 hours. Within this timeframe, ETH had dipped to a low of IDR 48,794,148 and reached a high of IDR 51,842,604.
At the time of writing, Ethereum’s market capitalization is estimated at around IDR 6,137 trillion, while its 24-hour trading volume has risen by 1.93% to approximately IDR 600.83 trillion.
Read also: Bitcoin Price Held at $89,000 Today: Can BTC Rebound?
Bullish Triangle and Divergence Pattern Faces Large Supply Zone Barriers
Ethereum is currently moving in a symmetrical triangle pattern on the daily chart. Previously, sellers rejected the price increase near the upper trend line, around January 14. Now, the price is testing the lower limit of the pattern. However, are buyers able to prevent a downward breakout?
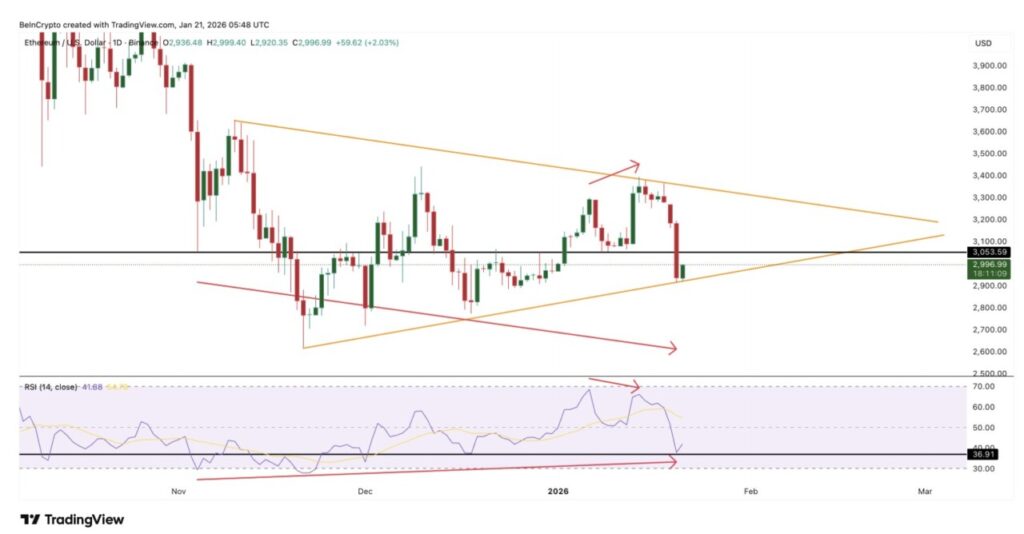
The momentum indicators provide important clues. Between November 4 and January 20, Ethereum printed lower lows, while the RSI showed higher lows. The RSI itself measures the strength of momentum by comparing recent price gains and losses. This bullish divergence indicates that selling pressure is starting to weaken, although the price is testing the support area.
Signals like this have proven important before. In early January, a bearish divergence on the RSI signaled the beginning of the price decline that was taking place. Now, the opposite signal is forming, which could indicate a potential reversal rather than a continuation of the downtrend.
However, this potential price bounce faces a major challenge. Average price data shows that there is a dense supply zone between the range of $3,146 to $3,164, where around 3.44 million ETH has been accumulated.
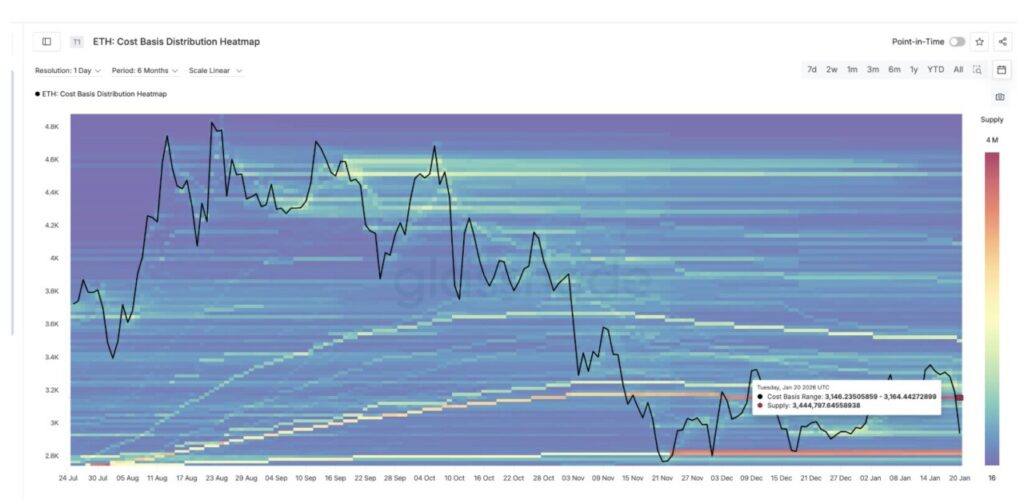
Many asset holders break even in this area, which usually makes it a strong resistance zone. Any rebound attempt should be able to break this zone to show strength and confirm a trend reversal, as signaled by the RSI.
Whale Buying as Prices Fall, but Smart Money is Still Waiting
The whales are showing strong conviction. When Ethereum’s price fell by around 13% between January 19 and 21, ETH holdings by whales rose from around 103.42 million to 103.71 million ETH. This increase equates to an accumulation worth nearly $360 million at current price levels. This pattern is not new.
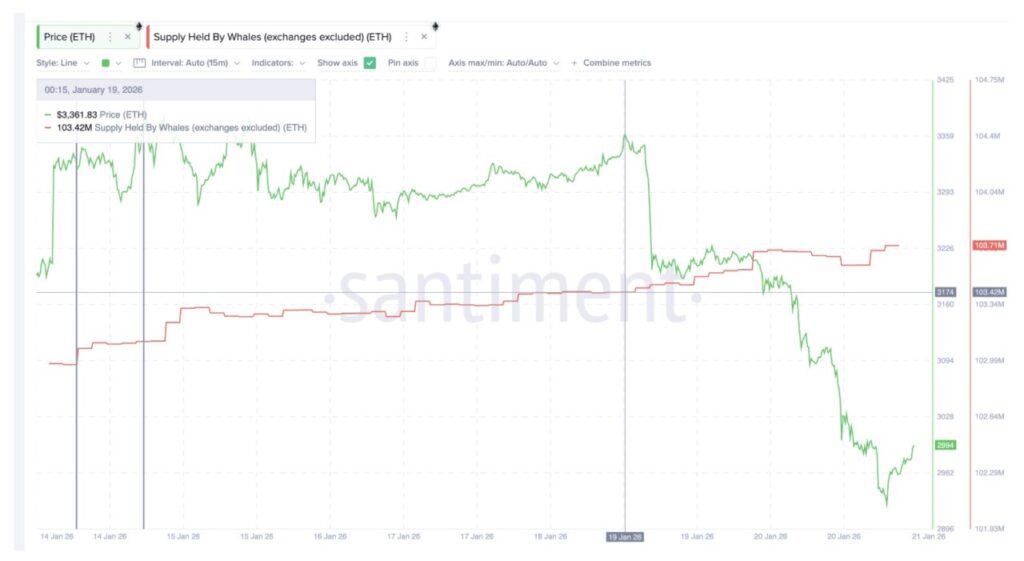
A similar buying spree by whales was also seen around January 14, just before the price spiked sharply. Even in the last few hours, whales have been seen buying ETH again.
This consistent accumulation indicates a belief that the price decline may be nearing its lower limit. Whales appear willing to absorb supply when the market is weak.
Read also: SUI Crypto Price: Could It Skyrocket to $10 as the Market Enters an Expansion Phase?
However, a different story came from smart money.
The smart money index, which tracks the positioning of knowledgeable market participants, is still below its signal line. Smart money usually moves early and aggressively before a major rally takes place.
For example, in December, when this indicator surpassed the signal line, the price of Ethereum rose by about 26% in ten days. A similar move in late December also preceded a 16% rise through mid-January.
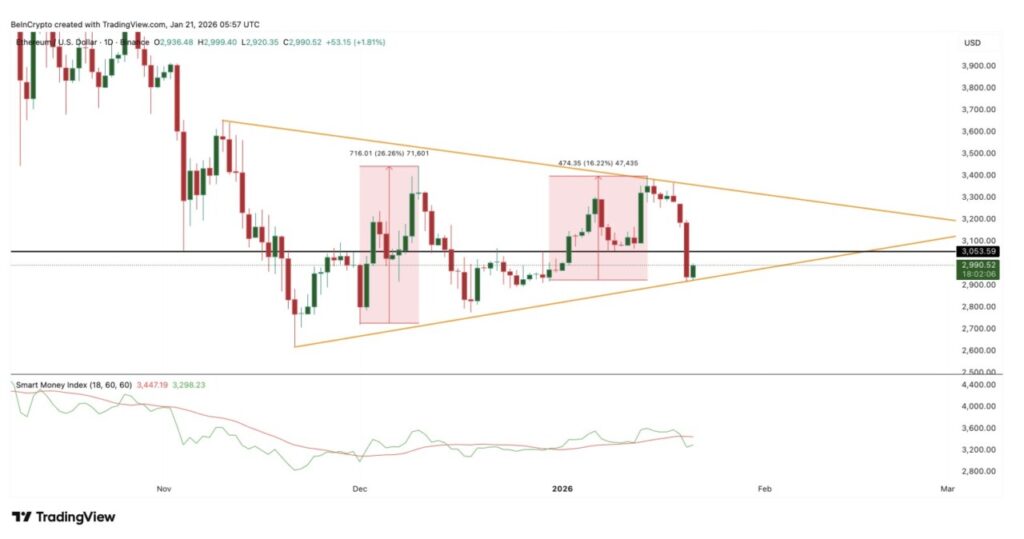
However, such confirmation has not been seen this time. Smart money still seems to be waiting for evidence that the resistance area was successfully broken. The dense high price zone above the current ETH price is the main reason for hesitation. Until the supply in that area is absorbed, being patient is a sensible move.
Ethereum Price Levels Show Key Zones
Right now, all attention is on the narrow price range that is crucial to Ethereum’s movement.
The first level that needs to be retaken is $3,050. Ethereum lost this strong support-which was tested many times before-when the latest sell-off occurred. A daily price close above this level would be an early signal of stabilization.
After that, the focus shifts to the $3,160 area. This level has many historical touchpoints and also coincides with a supply zone based on the average price of holdings. A clean daily close above it would mean an increase of about 6% from the current price.
More importantly, it will break through strong resistance and could trigger a re-entry of smart money. If that happens, a trend reversal scenario could start to take shape.
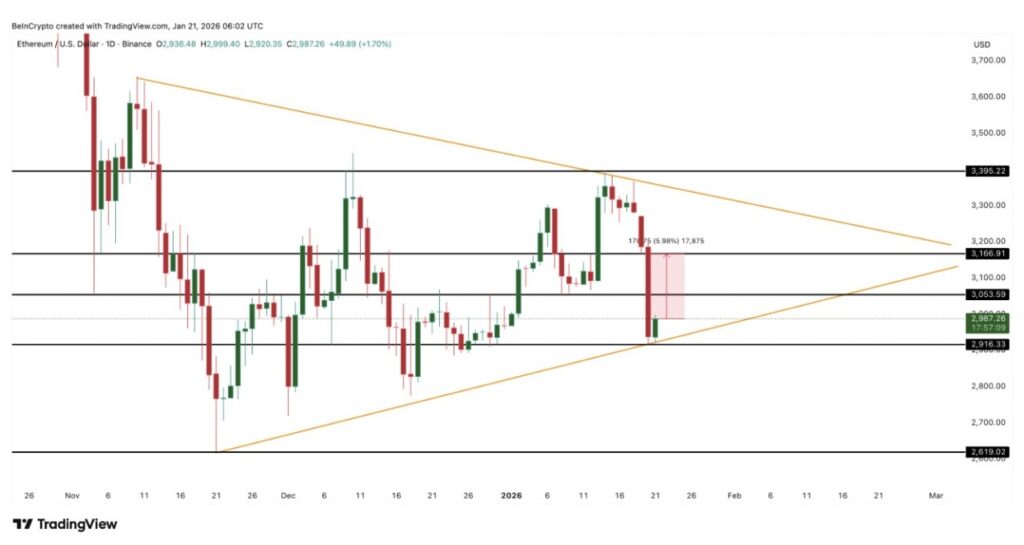
If a true breakout occurs, momentum could increase rapidly. This confirmation opens the way towards $3,390, where a larger bullish reversal pattern is likely to form.
Conversely, if Ethereum loses support from the lower line of the triangle pattern around $2,910, then hopes for a rebound will weaken further. A sustained drop from this level could drag the price to the next major support at $2,610.
Sellers may have won the final battle, but the “war” is still ongoing. Whales have started preparing for a rebound, while smart money is waiting for confirmation. If Ethereum manages to break through the supply wall at $3,160, doubts could turn into strong momentum.
Follow us on Google News to stay up to date with the latest in crypto and blockchain technology. Check Bitcoin price, usdt to idr and tokenized nvidia stock price through Pintu Market.
Enjoy an easy and secure crypto trading experience by downloading the Pintu crypto app via Play Store or App Store now. Also, experience web trading with advanced trading tools such as pro charting, various types of order types, and portfolio tracker only at Pintu Pro.
*Disclaimer
This content aims to enrich readers’ information. Pintu collects this information from various relevant sources and is not influenced by outside parties. Note that an asset’s past performance does not determine its projected future performance. Crypto trading activities are subject to high risk and volatility, always do your own research and use cold hard cash before investing. All activities of buying and selling Bitcoin and other crypto asset investments are the responsibility of the reader.
Reference:
- BeInCrypto. Ethereum Price Reversal at $3160 Level. Accessed on January 22, 2026